
UCP Trace Instructions

UCP Trace provides the ability to in-depth analysis of the scheduling logic of UCP applications by embedding trace recording on the critical path executed by UCP. When performance anomalies occur, it can quickly locate the time point of the anomaly by analyzing UCP trace.

UCP trace provides two trace backend options: Perfetto Trace and Chrome Trace. You can choose between them by setting an environment variable to meet your sepecific performance tracking needs.

  • Perfetto trace can retrieve ucp recorded traces, as well as system status, ftrace information, etc.
  • Chrome trace can only retrieve ucp recoreded traces and is mainly used to analyze UCP's scheduling logic.

The UCP trace tool and configuration files are located in the samples/ucp_tutorial/tools directory path, with a directory structures as follows:

	tools/
	└── trace                          # trace tools
		├── catch_trace.sh               # catch script for chrome trace
		├── configs                      # Reference configuration files
		│   ├── ucp_bpu_trace.cfg        # perfetto configuration file for bpu trace
		│   ├── ucp_in_process.cfg       # perfetto configuration file for in_process mode
		│   ├── ucp_in_process.json      # ucp configuration file for in_process mode
		│   ├── ucp_system.cfg           # perfetto configuration file for system mode
		│   └── ucp_system.json          # ucp configuration file for system mode

Environmental Variable

Environmental VariableRange of valuesDefault valuesDescription
HB_UCP_ENABLE_PERFETTOtrue,falsefalseWhether to enable the perfetto trace, defaults to not starting.
HB_UCP_PERFETTO_CONFIG_PATHPerfetto configuration file path""Specify the path to the perfetto configuration file. By default, it is empty, and if you do not need UCP to initialize perfetto, you can ignore this enviromental variable.
HB_UCP_TRACE_LOG_LEVEL[0, 6]6Specify the UCP trace log level, which defaults to 6 and is not output.
HB_UCP_USE_ALOGtrue,falsefalseWhether to enable the alog sink,defaults disabled. If enabled, logs will be output to the alog buffer and can be captured using logcat while logging is disabled for terminal output.
Note

Perfetto Trace has a higher priority and if export HB_UCP_ENABLE_PERFETTO=true while export UCP_TRACE_LOG_LEVEL=0 is also set, then only perfetto trace will be started and the ucp trace log will be ignored.

UCP Trace Records

UCP add trace records in the application API and internal critical scheduling paths, including task trace records and operator records.

Task Trace Records

NameDescription
hbDNNInferCreate a model inference task
hbVPxxxCreate a vision process task
hbHPLxxxCreate a high performance compute task
hbUCPSubmitTaskSubmit Task
${TaskType}::WaitWait task done
TaskSetDoneNotify task done
hbUCPReleaseTaskRelease task

Operator Trace Records

NameDescription
SubmitOpSubmit operator
OpInferOperator inference
OpFnishOperator finish

Perfetto Trace

Overview

Perfetto is a system analysis tool developed and open-sourced by Google, which can collect performance data from different data sources and provides the Perfetto UI for data visualization and analysis. For more details on Perfetto, please refer to the Perfetto offical document.

Configuration File

UCP Trace Configuration File

You can configure UCP to use the Perfetto by specifying it through the environment variable HB_UCP_PERFETTO_CONFIG_PATH.

Parameters Description

ParameterTypeRange of valuesDescription
backendstring"in_process","system"in_process represents the process-internal mode, where the perfetto trace is directly saved to a file within the process. System represents the system mode, where trace capture is performed by the background service traced and traced_probe.
trace_configstringconfiguration file for perfettoIt is available when the backend is set to in_process, the file is protobuf text format.
Note

The UCP trace configuration file is not necessary when your application has already initiaized Perfetto, you only need to export HB_UCP_ENABLE_PERFETTO=true to enable Perfetto.

Example 1: in_process mode

{
    "backend": "in_process",
    "trace_config": "ucp_in_process.cfg"
}

Sample 2: system mode

{
    "backend": "system"
}
Note

When selecting the system for backend, there is no need to specify trace_config separately for UCP.

Perfetto Configuration File

For detailed information about perfetto configuration files, please refer to Perfetto TraceConfig Reference. UCP provides reference configuration files ucp_in_process.cfg and ucp_system.cfg, which can be modified based on application scenario.

Example: ucp_in_process.cfg

# Enable periodic flushing of the trace buffer into the output file.
write_into_file: true

# Output file path
output_path: "ucp.pftrace"

# Sampling duration: 10s
duration_ms: 10000

# Writes the userspace buffer into the file every 2.5 seconds.
file_write_period_ms: 2500

buffers {
  # buffer size
  size_kb: 65535
  # DISCARD: no new sampling data will be stored when the storage is full.
  # RING_BUFFER: old sampling data will be discarded and new data will be stored when the storage is full.
  fill_policy: RING_BUFFER
}

# UCP data source
data_sources: {
    config {
        name: "track_event"
        track_event_config {
           enabled_categories: "dnn"
        }
    }
}

Example

in_process mode

In the in_process mode, only trace within UCP process can be captured, and it is not necessary to start the background process of perfetto.

Operating Procedure
  1. Configure environment variables.
# Specify the ucp perfetto configuration path.
export HB_UCP_PERFETTO_CONFIG_PATH=ucp_in_process.json

# Enable perfetto.
export HB_UCP_ENABLE_PERFETTO=true
Note

In the ucp_in_process.json, the configuration file for perfetto is specified as ucp_in_process.cfg, and the output_path specifies the path for output trace file. Due to the fact that Perfetto does not support directly overwriting existing trace files, if the file already exists, it needs to be deleted first.

  1. Running the UCP application, using hrt_model_exec as an example.

Due to the specified file path is a relative path, the trace configuration file and scripts need to be placed in the same level directory as the running program. Also, you need to make sure that you configure the environment variables and run the program in the same shell environment.

./hrt_model_exec perf                      \
    --model_file resnet50_224x224_nv12.hbm \
    --frame_count 1000                     \
    --thread_num 8
  1. The generated trace is saved in the output file ucp.pftrace specified by the perfetto command, and you can use Perfetto UI to open it.
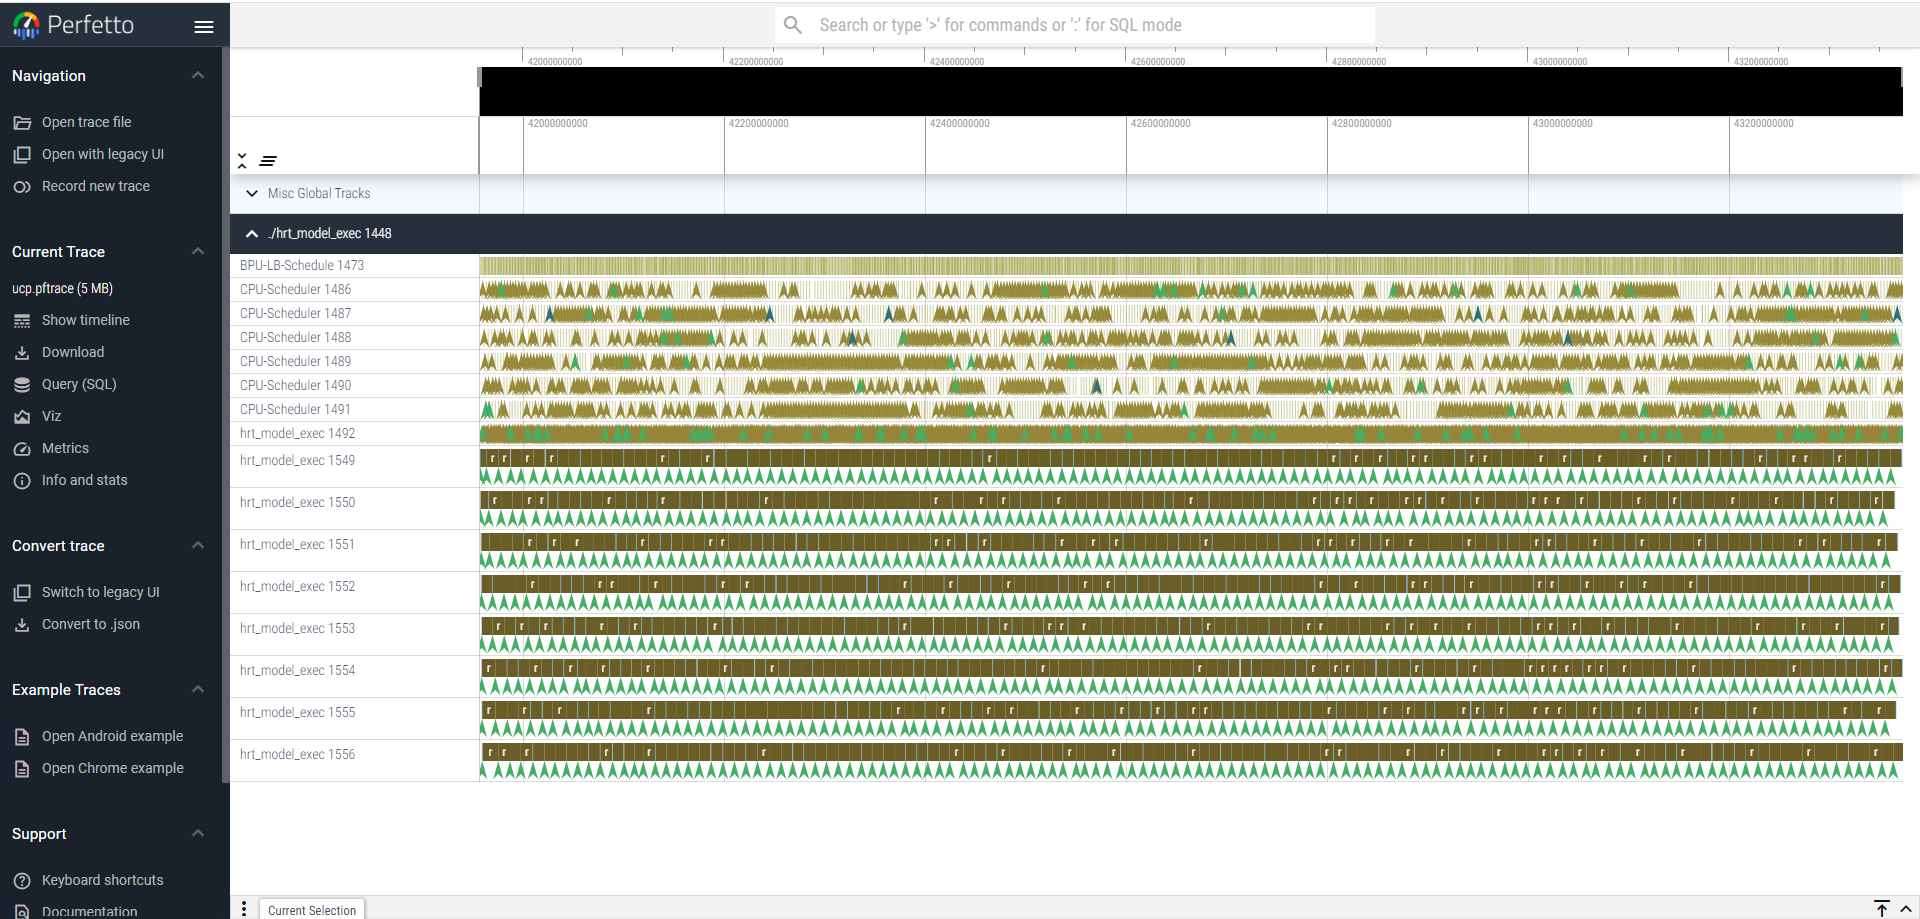
ucp_in_process
  1. Clicking on the task in the timeline will show the complete scheduling process from creation to release of the task.

ucp_trace_flow
  1. The common operations of Perfetto UI are as follows, for more detailed operation Instructions, please refer to the help interface.
OperationsDescription
w or ctrl + scroll up with the mouse wheeelZoom in
s or ctrl + scroll down with the mouse wheeelzoom out
a or drag the time bar to the leftPan left
d or drag the time bar to the rightPan right
?Show help

system mode

In system mode, UCP trace is just one of the data sources, so it it necessary to run the corresponding commands for tracebox to complete the capture of trace.

Operating Procedure
  1. Running the perfetto background process.
# Start trace service.
# Start once, no need to start it again when it is already started.
tracebox traced --background

# Start data capture service.
# Start once, no need to start it again when it is already started.
tracebox traced_probes --background --reset-ftrace
  1. Trigger data capture.
# -c: Specify perfetto configuration file
# -o: Specify output path of trace data.
tracebox perfetto --txt -c ucp_system.cfg -o ucp.pftrace
  1. Open a new terminal and configure the UCP environment variables.
# Specify the ucp perfetto configuration path.
export HB_UCP_PERFETTO_CONFIG_PATH=ucp_system.json

# Enable perfetto.
export HB_UCP_ENABLE_PERFETTO=true
  1. Running the UCP application, using hrt_model_exec as an example.

To be able to capture complete data, it is necessary to ensure that the perfetto process does not exit before the hrt_model_exec execution is complete.

./hrt_model_exec perf                      \
    --model_file resnet50_224x224_nv12.hbm \
    --frame_count 1000                     \
    --thread_num 8
  1. The generated trace is saved in ucp.pftrace, and you can use Perfetto UI to open it.
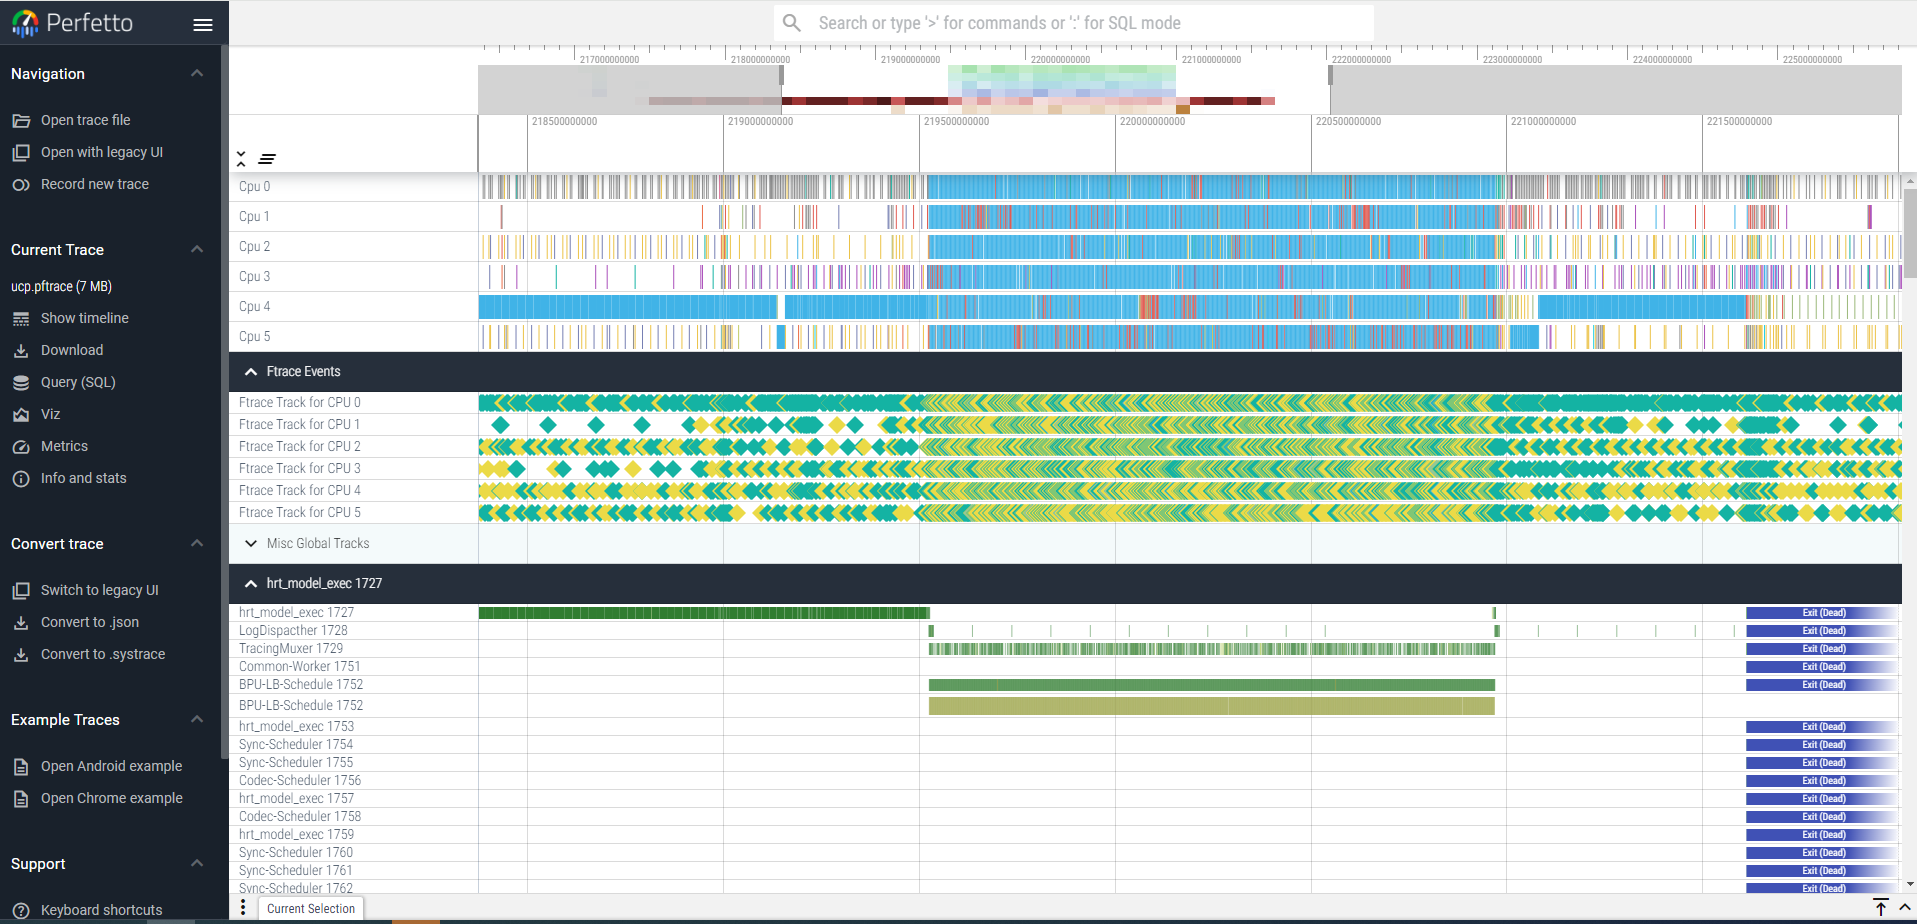
ucp_system

BPU Trace

In system mode, BPU trace capture is supported. Simply add BPU trace data source to the perfetto configuration file. The ucp_bpu_trace.cfg file has already defaultly included the BPU trace data source. The specific configuration items are shown below.

data_sources: {
    config {
        name: "linux.sys_stats"
        sys_stats_config {
            bputrace_period_ms: 500
        }
    }
}

The bpu_trace_period_ms is used to set the period for reading the BPU trace. You can adjust this parameter according to your actual usage scenario. When the BPU load is high, you can appropriately shorted the reading period to avoid the problem of trace data being overwritten due to mismatched read and write speeds.

To demonstrate the BPU trace during the inference process of multiple models, an example of a multi-process application is provided here. Except for the different running programs being launched, the rest of the steps are the same as in the previous section.

./hrt_model_exec perf                        \
    --model_file resnet50_224x224_nv12.hbm   \
    --frame_count 50                         \
    --thread_num 1 &                         \

./hrt_model_exec perf                        \
    --model_file googlenet_224x224_nv12.hbm  \
    --frame_count 50                         \
    --thread_num 1                           \

Visualization of BPU trace requires the use of the hbperfetto tool, which is custom-developed by Horizon Robotics. You can obtain this tool by contacting the Horizon Robotics system software technical support personnel. The effect of opening a trace file using hbperfetto is shown in the image below.
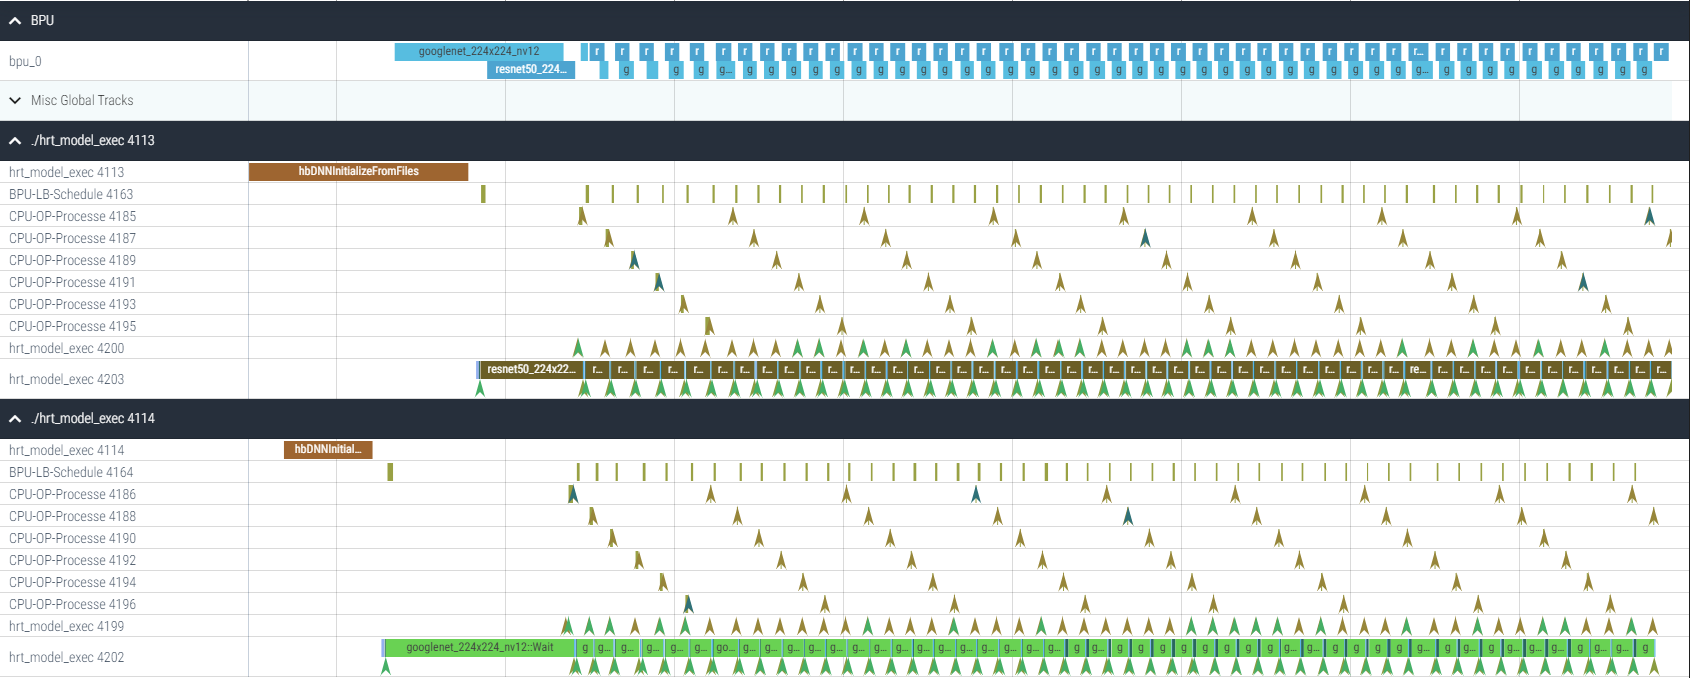
bpu_trace_overview

The scheduling of different model inference tasks presented in BPU trace is shown in the following figure.

bpu_trace_schedule

hbperfetto supports the association of UCP trace and BPU trace. The following diagram illustrates the complete process from the creating, submission, scheduling and execution, to the task's completion and eventual releases.
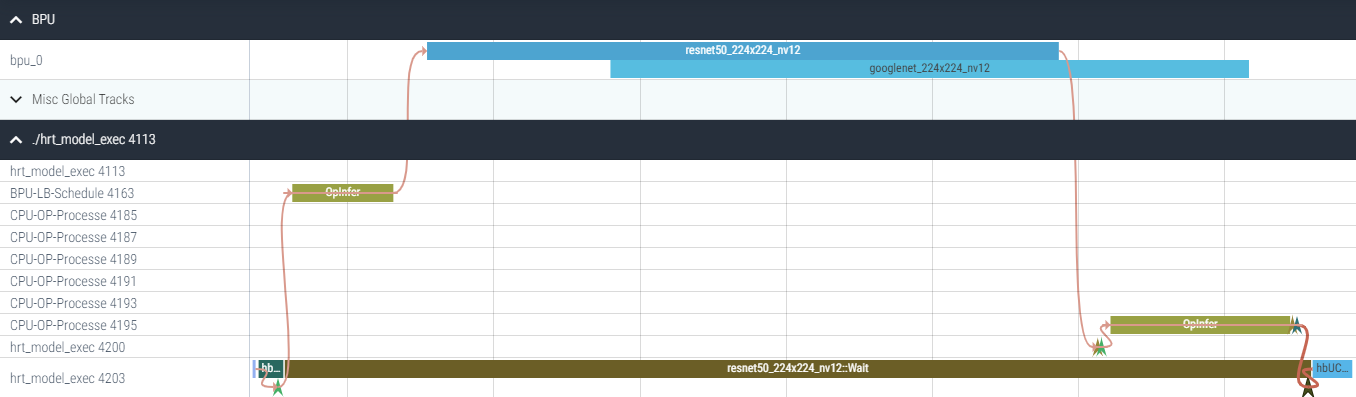
ucp_bpu_trace

Additionally, you can query the raw data of BPU trace based on SQL.
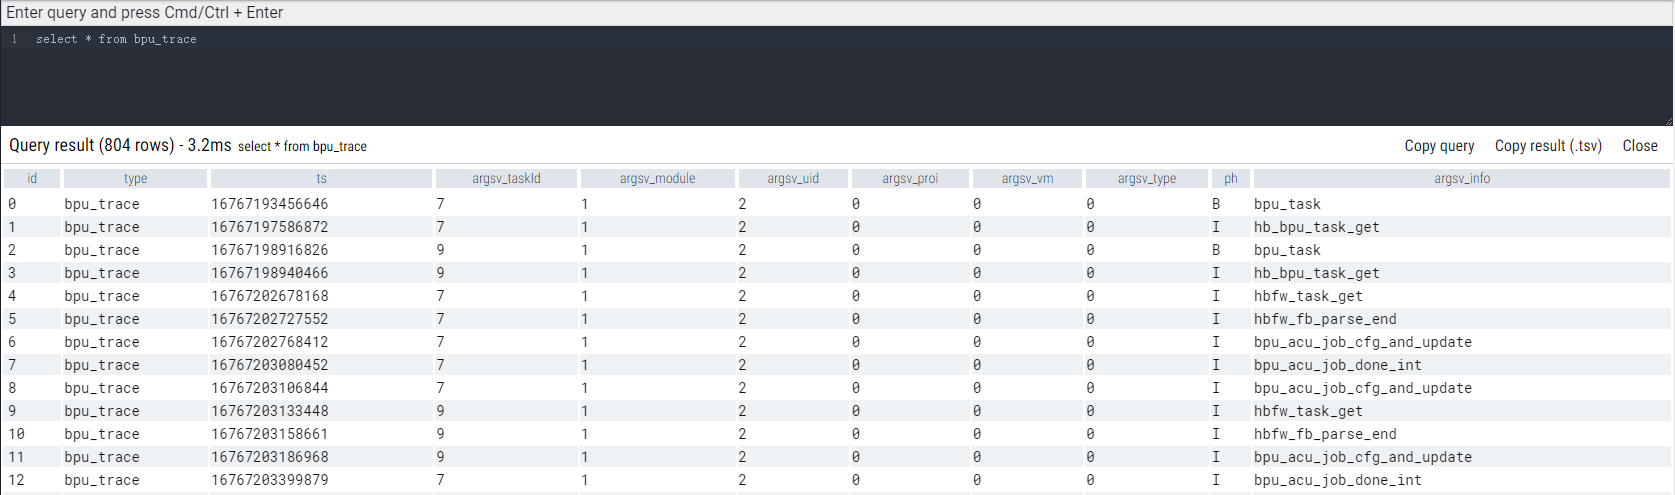
select * from bpu_trace
ucp_bpu_trace

Long Trace Configuration

By default, Perfetto stores trace data in an in-memory buffer until the trace session ends, at which point the data in the buffer is dumped to a file. If the trace data exceeds the buffer capacity, there is no guarantee of data integrity.

Perfetto supports periodically writing buffer data to a file, which can be achieved by adding the following fields to the trace configuration file.

ConfiguraitonTypeDescription
write_into_filebooltrue enable periodic write into a file, which is not enabled by default.
file_write_period_msuint32Set the write cycle to the file, with a default value of 5s. You can set an appropirate write cycle based on the size of the data generated per second and the capacity of the trace buffer.
max_file_size_bytesuint64Set the maximum value for the trace file, after which the trace will automatically terminate, with no default limit.

Introduction to Common Data Sources

Event typeData source namehbperfetto customizeConfiguraitonDescription
Application's track eventstrack_eventNotrack_event_configUsed to capture data from applications that use the perfetto sdk api for instrumentation.
ftracelinux.ftraceNoftrace_configSpecify the events to capture through ftrace_events, such as sched/sched_switch. The specific supported events can be viewed through /sys/kernel/tracing/available_events. For detailed information on ftrace_config, please refer to FtraceConfig
System memorylinux.sys_statsNosys_stats_configSpecify the sampling period through the meminfo_period_ms, specify the type of data to capture through meminfo_counters, such as MEMINFO_MEM_AVAILABLE. For detailed information on sys_stats_config, please refer to SysStatsConfig
Process memorylinux.process_statsNoprocess_stats_configSpecify the sampling period through the proc_stats_poll_ms. For detailed information on process_stats_config, please refer to ProcessStatsConfig
CPU usagelinux.sys_statsNosys_stats_configSpecify the sampling peroid through the stat_period_ms.
perflinux.perfNoperf_event_configRecord process call stack and perf count. For detailed information on perf_event_config, please refer to PerfEventConfig
DDR bandwidthlinux.sys_statsYessys_stats_configRecord DDR read and write bandwidth, and specify the sampling period through the ddrinfo_period_ms.
ION memorylinux.sys_statsYessys_stats_configRecord ION memory information, and specify the sampling period through the ion_period_ms.
BPU usagelinux.sys_statsYessys_stats_configRecord BPU usage, and specify the sampling peroid through the bpuinfo_period_ms.
BPU tracelinux.sys_statsYessys_stats_configRecord BPU trace information, and specify the sampling peroid through the bputrace_period_ms.

Chrome Trace

Chrome trace only supports capturing UCP trace, and does not support capturing data sources. For capturing multiple data sources, please use Perfetto trace. The characteristic of Chrome trace is simplicity and ease of use, using text logs to record traces without depending on any extra thrid-party libraries or tools. If you are only interested in the scheduling logic of UCP, you can use Chrome trace to capture it.

Example

  1. Configure environment variables.
# Disable perfetto
export HB_UCP_ENABLE_PERFETTO=false

# Set the log level of UCP trace to 0.
export HB_UCP_TRACE_LOG_LEVEL=0

# Set the file path for UCP log saving.
export HB_UCP_LOG_PATH=ucp_log.txt
Note

Before starting new capture, it is recommended to delete the old log files to avoid interference from old data.

  1. Running the UCP application, using hrt_model_exec as an example.
./hrt_model_exec perf                      \
    --model_file resnet50_224x224_nv12.hbm \
    --thread_num 8
  1. Execute trace capture script.

After capturing the trace logs, run the catch_trace.sh provided in the UCP distribution package to convert the raw trace logs into a json-formatted trace file.

# -i: Specify input trace log file
# -o: Specify output json-formatted trace file.
./catch_trace.sh -i ucp_log.txt -o ucp_trace_task.json

# Visualize trace as task view by defalut, but you can switch to thread view as well.
# -m: Specify convert mode,task: task view (default),thread: thread view.
./catch_trace.sh -m thread -i ucp_log.txt -o ucp_trace_thread.json
  1. Open ucp_trace_task.json and ucp_trace_thread.json using Perfetto UI or Chrome UI(chrome://tracing/).

Open ucp_trace_task.json by Chrome UI:
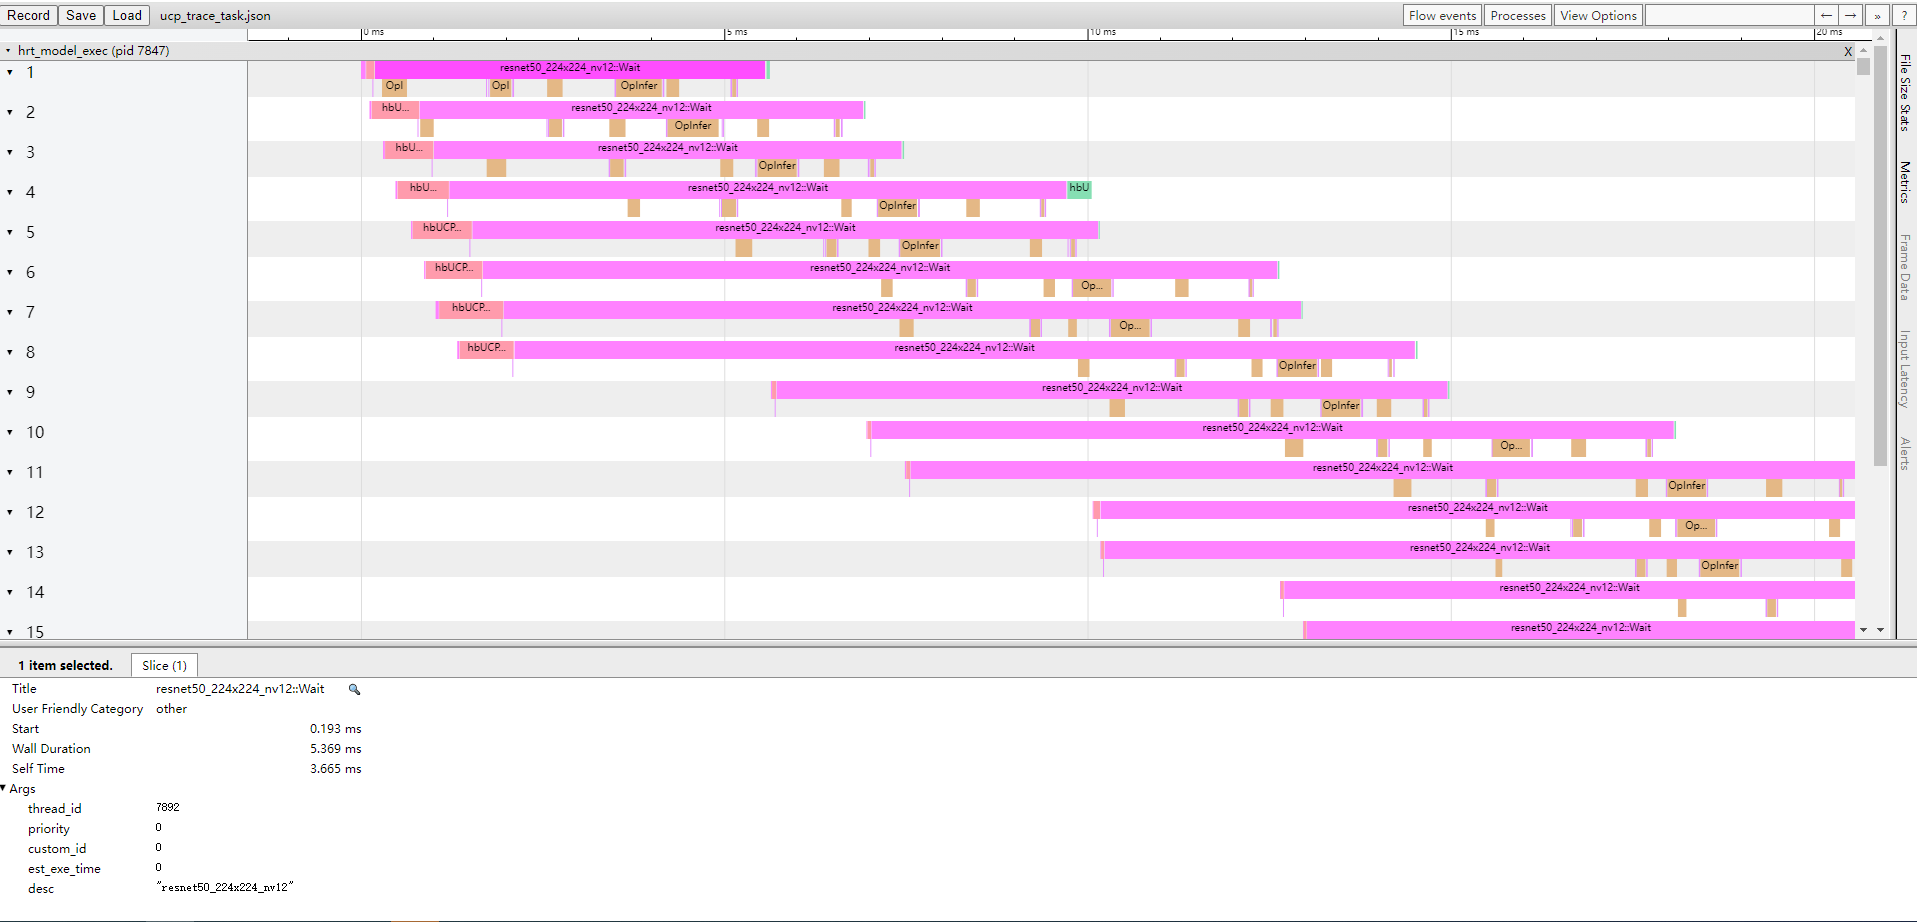
chrome_task

Open ucp_trace_thread.json by Perfetto UI:
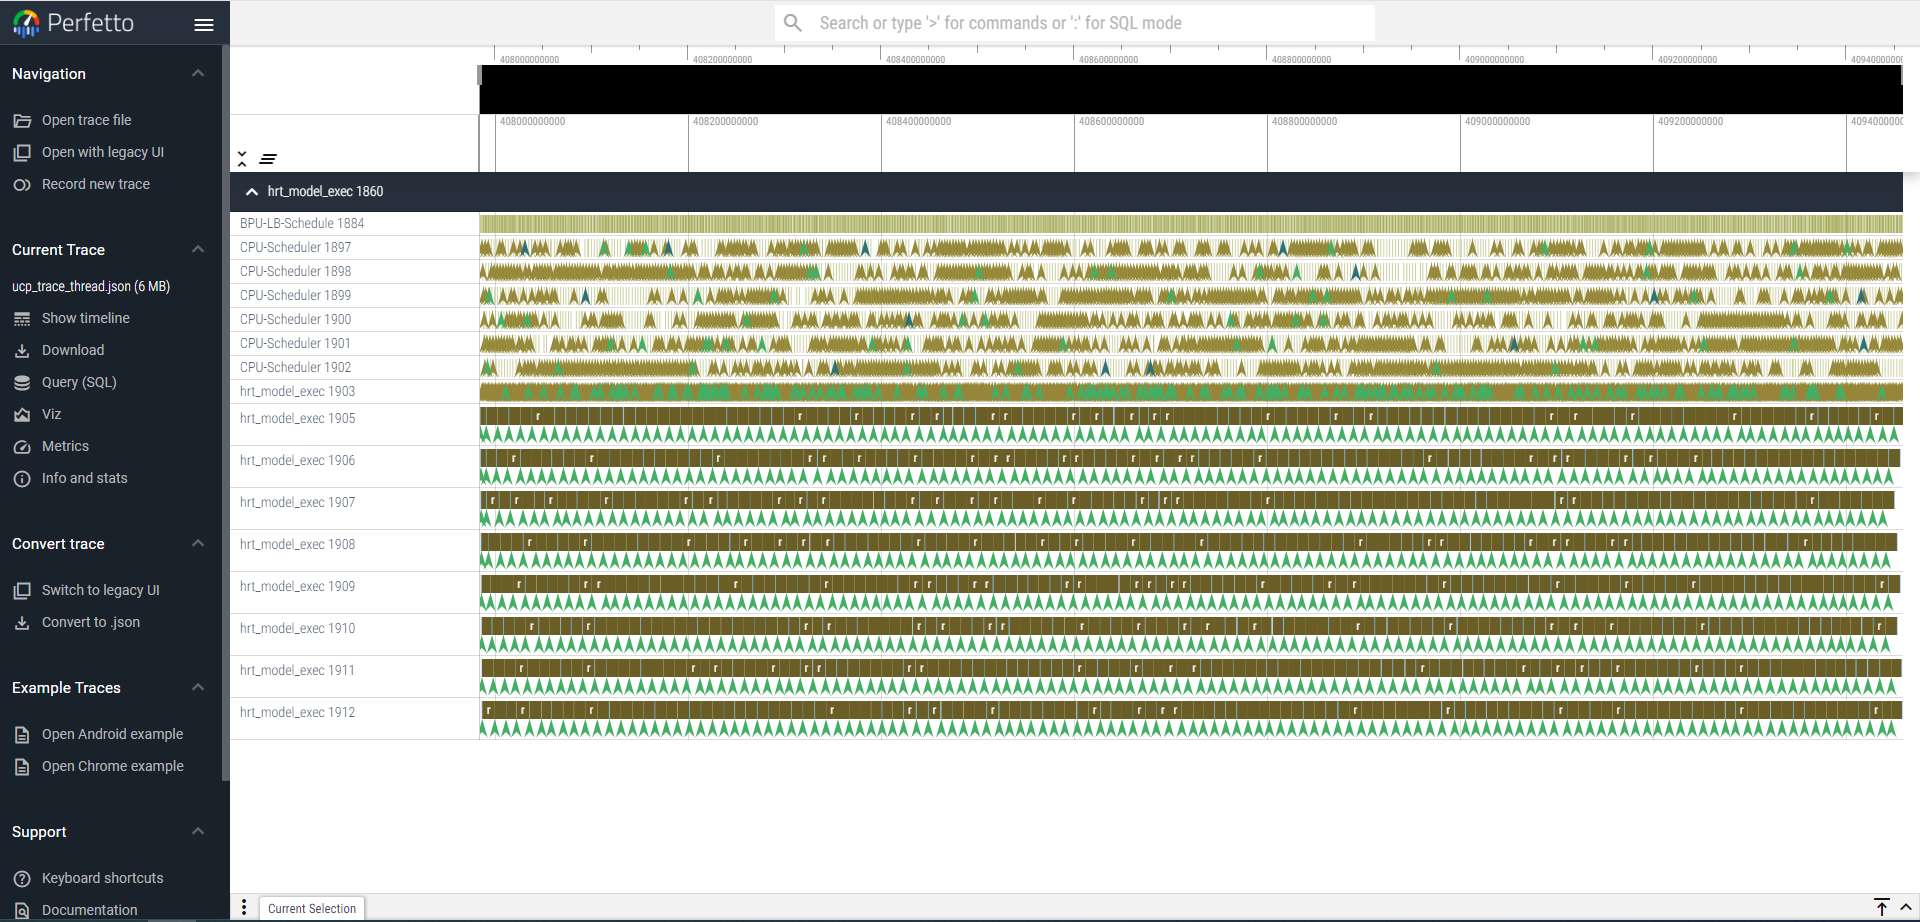
chrome_thread