

Model Performance Evaluation
In this section, we will introduce how to perform performance evaluation on models, including estimating the performance of the BPU part of the model on the development machine side and quickly evaluating the model performance using the code-free executable tool provided by us on the board side.
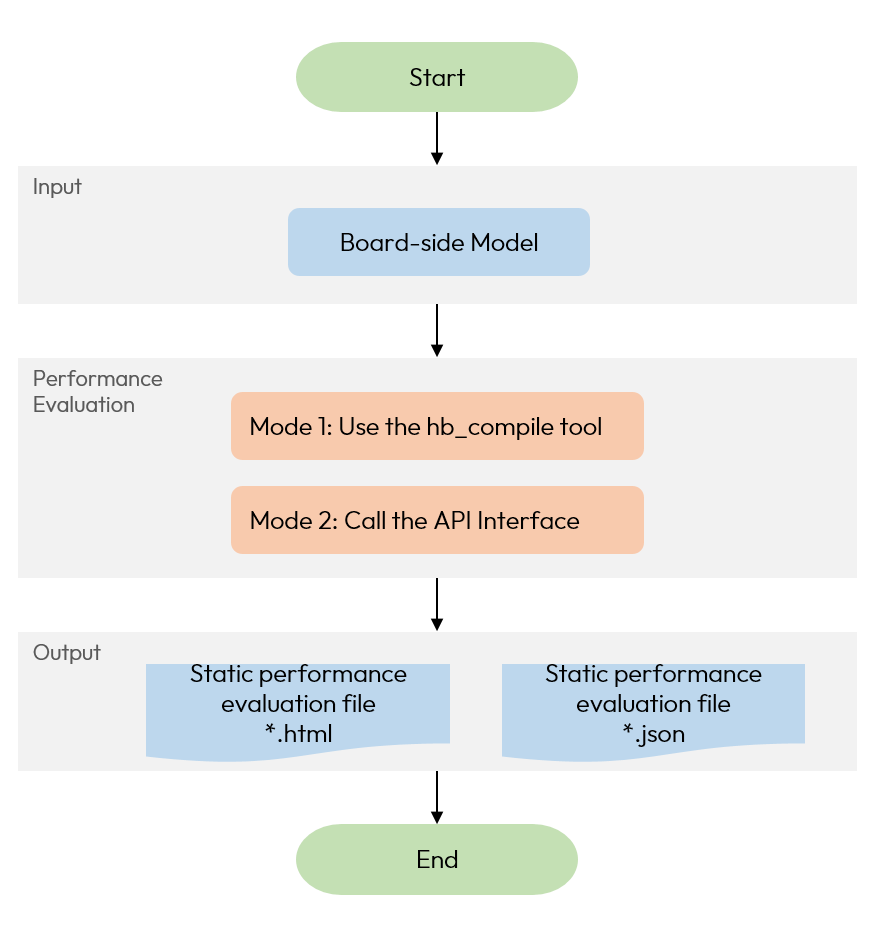
On the development machine side, we support you to evaluate model performance through two paths:
-
Use the
hb_compiletool provided by Horizon Robotics to evaluate model performance. -
Call the performance analysis API interface to evaluate model performance.
On the development board side, we support you in quickly conducting on-board actual performance testing of the model through the provided executable tool hrt_model_exec.
Whether There Are CPU Operators in the Model
Before conducting model performance evaluation, we recommend that you first determine whether there are CPU operators in the model. CPU operators will interrupt the model and introduce additional quantization, dequantization, and DDR overhead. Therefore, it is recommended that if there are CPU operators in the model, We highly recommend that you refer to the Performance Tuning - Process CPU operators section, remove the CPU operators first, and then conduct the model performance evaluation.
The methods to determine whether there are CPU operators in the model include the following:
- Quickly determine whether the model contains CPU operators.
-
We recommend using The hb_analyzer Tool to directly check whether the model contains CPU operators.For detailed usage instructions and guidance on interpreting the analysis report, please refer to the corresponding section.
-
Alternatively, you can use the following code example to check whether the provided xxx.bc or xxx.hbm model contains CPU operators.Generally, operators with the hbtl.call prefix in xxx.bc are considered CPU operators.
- Use the The hb_analyzer Tool to visualize the model. If you want to view specific operator types and more information, you need to visualize the model. The reference command is as follows:
- On the board side, use the The hrt_model_exec Tool to check the time consumption of CPU operators in the model. If you want to view the time consumption of specific CPU operators, you can use the hrt_model_exec tool provided by us to check it. The reference command is as follows:
In the generated profiler.log or profiler.csv file, locate the CPU operators corresponding to the model_latency parameter to view the corresponding time consumption information.
After checking whether there are CPU operators in the model, you can proceed with the subsequent model performance evaluation. Below is a detailed introduction to two methods: simulated performance evaluation on the development machine side and actual measurement of model performance data on the board side.
Simulated Performance Evaluation on the Development Machine Side
Using the hb_compile Tool
You can use the hb_compile tool provided by us to perform quantization compilation on the model.
After the model conversion is completed, performance evaluation files for the BPU part of the model (estimated values) will be generated in the working_dir path configured in the yaml file: model.html (better readability) and model.json.
The tool supports two usage modes: the fast performance evaluation mode (with fast-perf enabled) and the traditional model conversion and compilation mode (with fast-perf disabled).
For detailed usage methods, specific configurations, and parameters of the tool, please refer to the The hb_compile Tool - Model Quantization Compilation section.
Below is a reference method for using this tool for performance evaluation:
- Fast Performance Evaluation Mode(Recommend)
For Onnx model:
For Caffe model:
Please note that if you enable the fast performance evaluation mode (fast-perf mode):
-
In this mode, the tool uses built-in high-performance configurations, so do not configure the
--configparameter. -
When using hb_compile for model quantization compilation, the configuration of the
--input-shapeparameter only takes effect in the fast performance evaluation mode (i.e., with fast-perf enabled).
- Traditional Model Conversion Compilation Mode
Call the Performance-analysis API
We also support you in conducting model performance analysis by calling the performance-analysis API, for API documentation, please refer to the HBDK Tool API Reference section, The reference command is as follows:
After successful execution, basic information such as the model's FPS will be printed in the terminal, and meanwhile, the static performance evaluation files for the model will be generated in the directory where the API is currently called:
You can select either the model.html or the model.json to view the static performance data for the BPU part.
If you need to specify the path to the static performance evaluation file, you can refer to the following command:
If you configure the development board parameter remote_ip when calling hbm_perf, it will remotely connect to the development board for performance evaluation,
and similarly generate the performance evaluation file for the model in the directory where the current API interface is called.
The interpretation of indicators in the performance evaluation files generated by using the hb_compile tool or calling the performance-analysis API can refer to the Metric Interpretation of Simulation Performance Evaluation section.
Actual Measurement of Model Performance Data on the Board Side
After the static performance of the model meets expectations, you can further conduct on-board actual measurement of the model's dynamic performance. We provide the hrt_model_exec tool for you to perform on-board actual measurement of hbm model performance data. For detailed usage instructions of the tool, please refer to The hrt_model_exec Tool - Model Performance Evaluation section, The simplest reference command for on-board actual measurement of model performance is as follows:
After the command is executed, the following information will be output:
-
Running condition indicates the configuration items for performance evaluation:
-
Thread number: The number of program running threads (parallelism).
-
Frame count: The number of frames the model runs.
-
Program run time: The time taken for the performance evaluation program to run.
-
-
Perf result indicates the performance evaluation results:
-
Frame totally latency: The total time taken for the model to run.
-
Average latency: The average time taken for the model to run one frame.
-
Frame rate: The frame rate information of the model.
-
If you find that the model performance evaluation results do not meet your expectations, you can refer to section Model Performance Optimization to perform performance tuning.