

UCP Trace Instructions
UCP Trace provides the ability to in-depth analysis of the scheduling logic of UCP applications by embedding trace recording on the critical path executed by UCP. When performance anomalies occur, it can quickly locate the time point of the anomaly by analyzing UCP trace.
UCP trace provides two trace backend options: Perfetto Trace and Chrome Trace.
You can choose between them by setting an environment variable to meet your specific performance tracking needs.
-
Perfetto tracecan retrieve ucp recorded traces, as well as system status, ftrace information, etc. -
Chrome tracecan only retrieve ucp recorded traces and is mainly used to analyze UCP's scheduling logic.
Basic Usage and Results
Perfetto Trace
Perfetto is a performance analysis tool developed and open-sourced by Google. It can collect performance data from different data sources and provides Perfetto UI for visualization and analysis. For more details about Perfetto, refer to the official Perfetto documentation.
in_process Mode Example
In in_process mode, only trace information inside the UCP process can be captured, and no Perfetto background process is required. The steps are as follows:
-
Configure environment variables.
ucp_in_process.json specifies the Perfetto configuration file ucp_in_process.cfg, in which output_path defines the output path of the trace file. Since Perfetto does not support directly overwriting an existing trace file, you must delete the file first if it already exists.
- Run the UCP application.
hrt_model_execis used here as an example.
Because the specified file path is a relative path, the trace configuration files and scripts must be placed in the same directory as the executable. Also make sure that the environment variables are configured and the program is run in the same shell session.
-
The generated trace is saved as
ucp.pftrace, which you can open with Perfetto UI.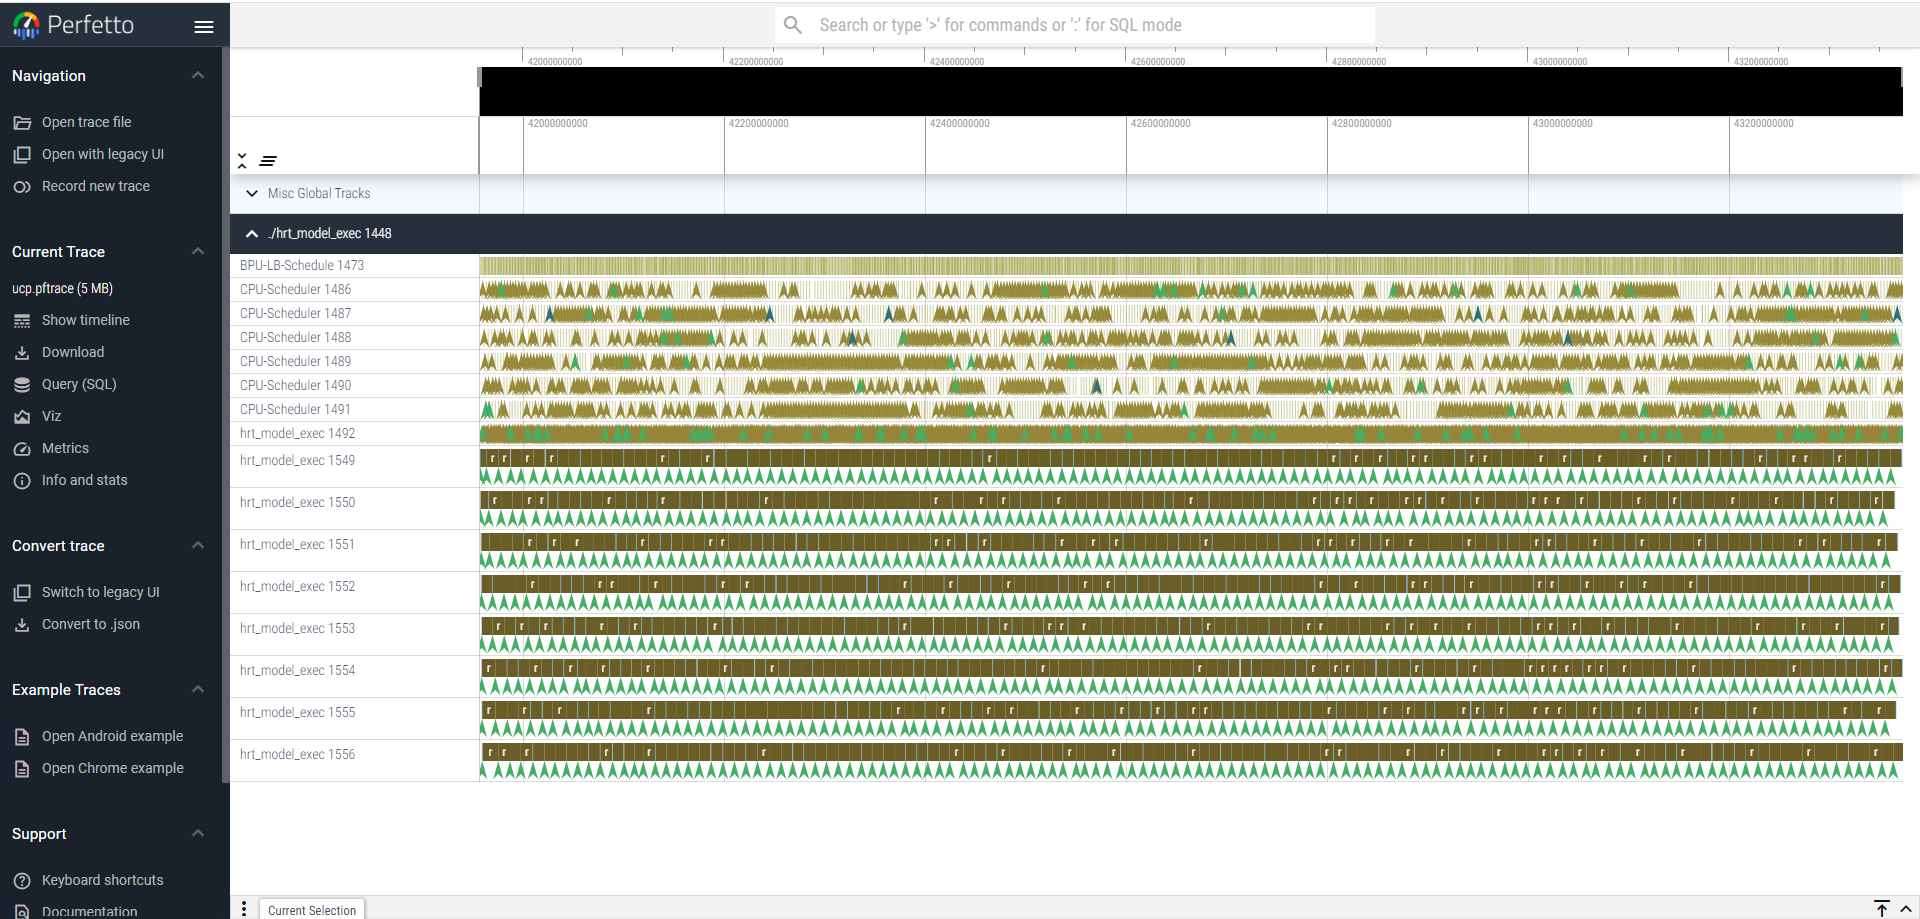
-
Click a created task on the timeline to view the complete scheduling flow from task creation to task release.

-
Common Perfetto UI operations are listed below. For more details, refer to the
helppage.
System Mode Example
In system mode, UCP Trace is only one of the data sources, so you need to run the corresponding tracebox commands to complete trace capture. The steps are as follows:
-
Start the Perfetto background processes.
-
Trigger data capture.
-
Open another terminal and configure UCP environment variables.
-
Run the UCP application.
hrt_model_execis used here as an example.
To capture complete data, make sure the perfetto process does not exit before hrt_model_exec finishes.
-
The generated trace is saved to the output file
ucp.pftracespecified by theperfettocommand, and you can open it with Perfetto UI.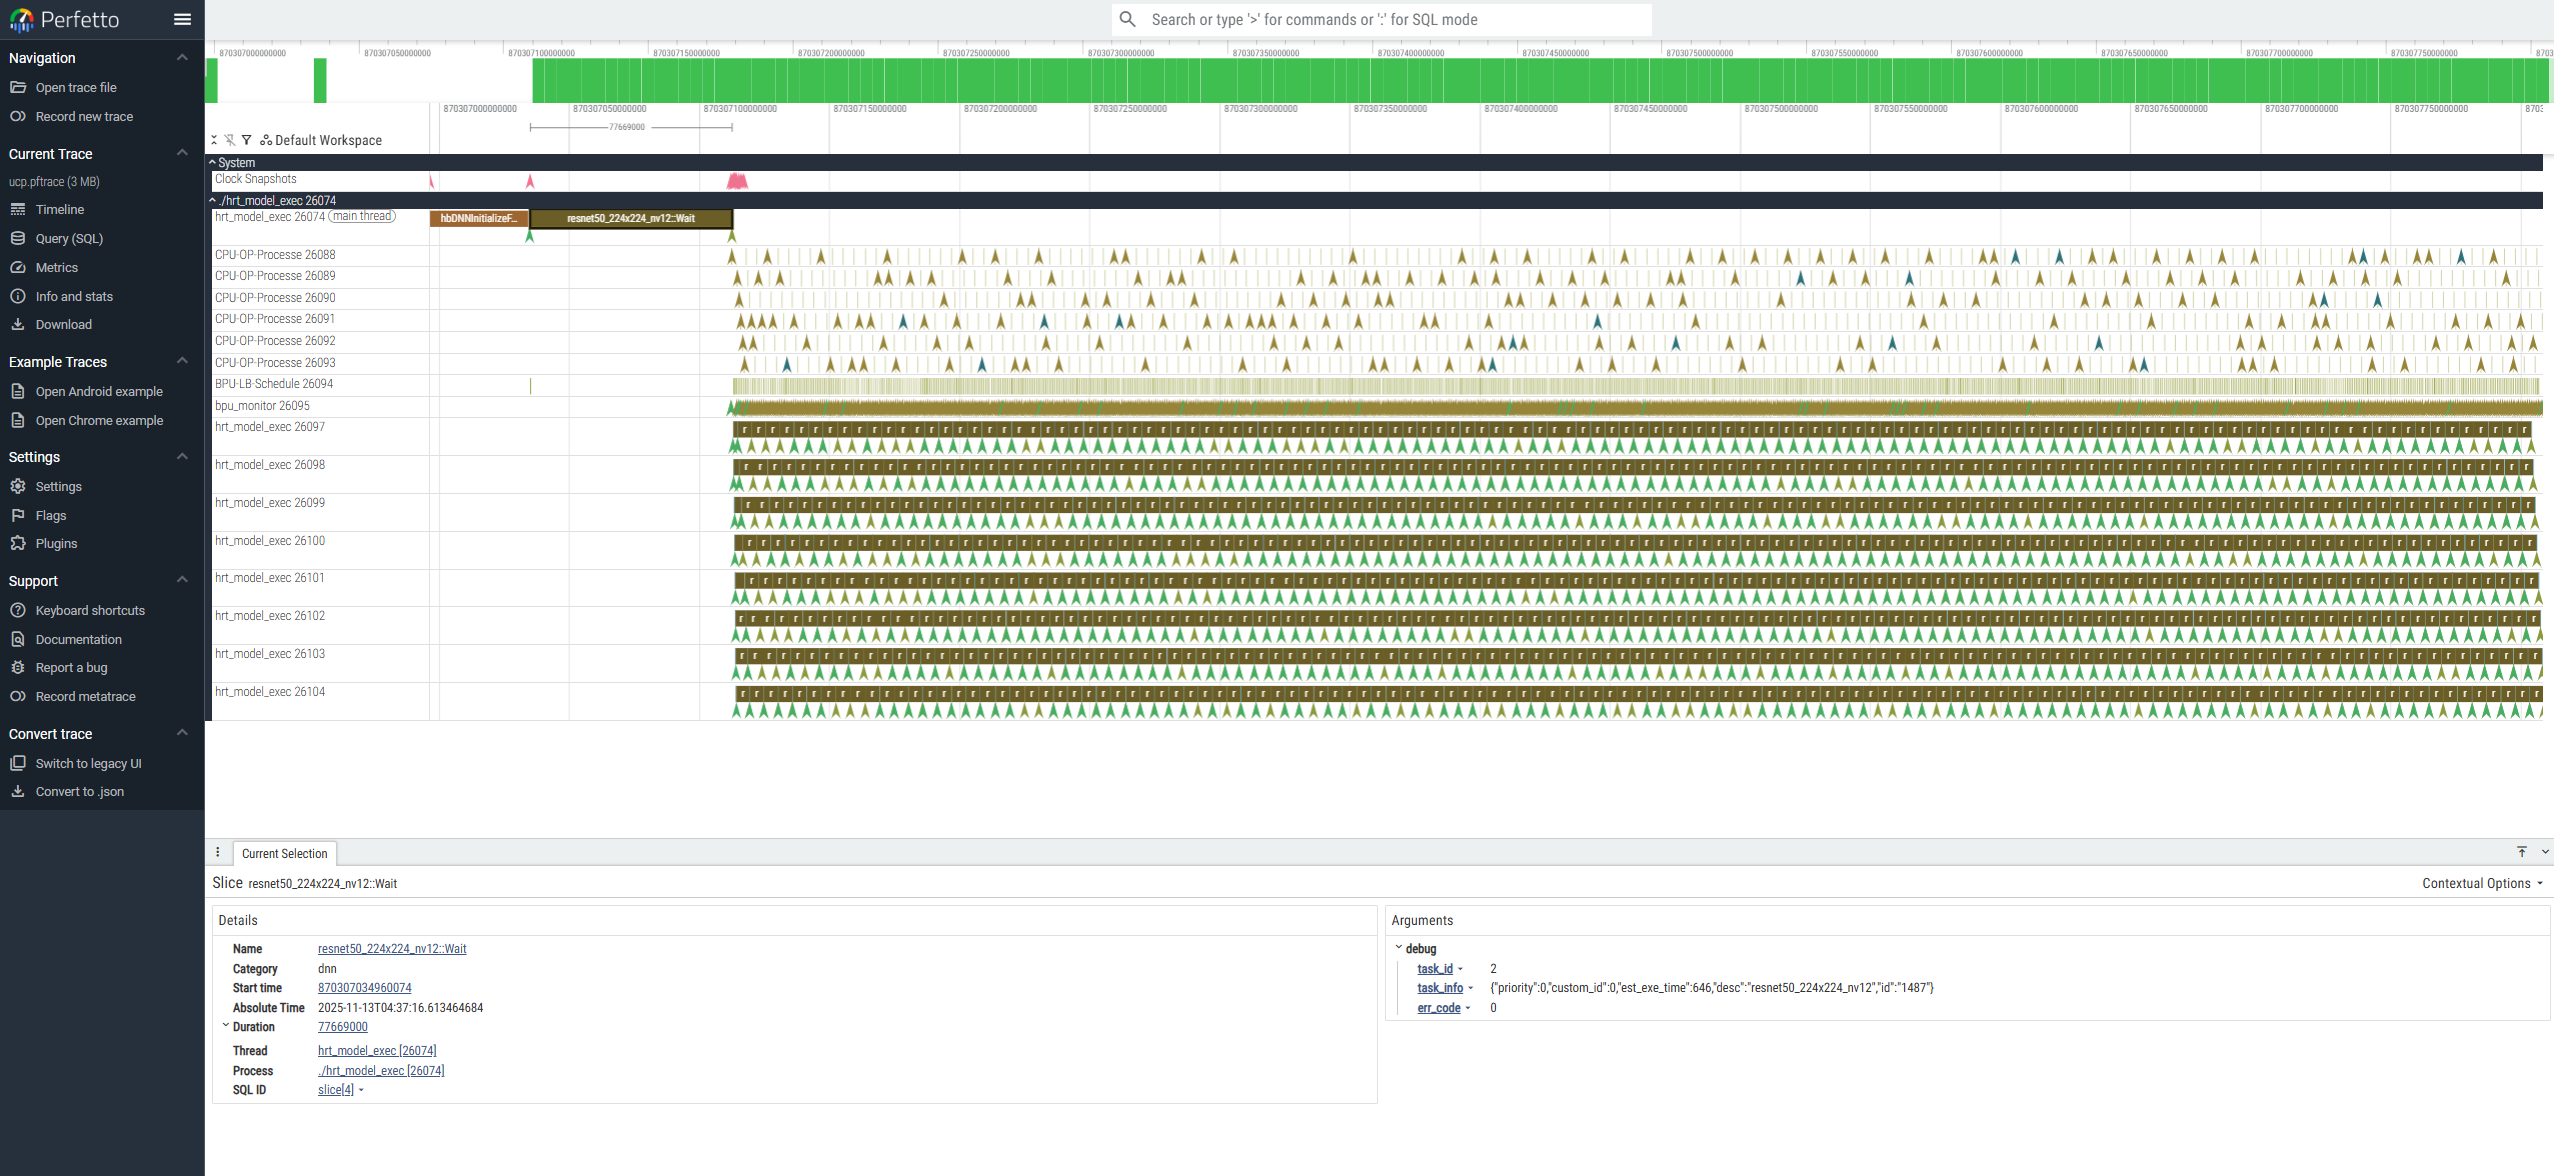
BPU Trace Example
To demonstrate BPU trace during multi-model inference, a multi-process application example is provided here. Except for the different programs being launched, the remaining steps are the same as in the previous section.
BPU Trace visualization requires the Horizon-customized hbperfetto tool. You can obtain this tool by contacting Horizon system software technical support. The following figure shows the effect after opening the trace file with hbperfetto:
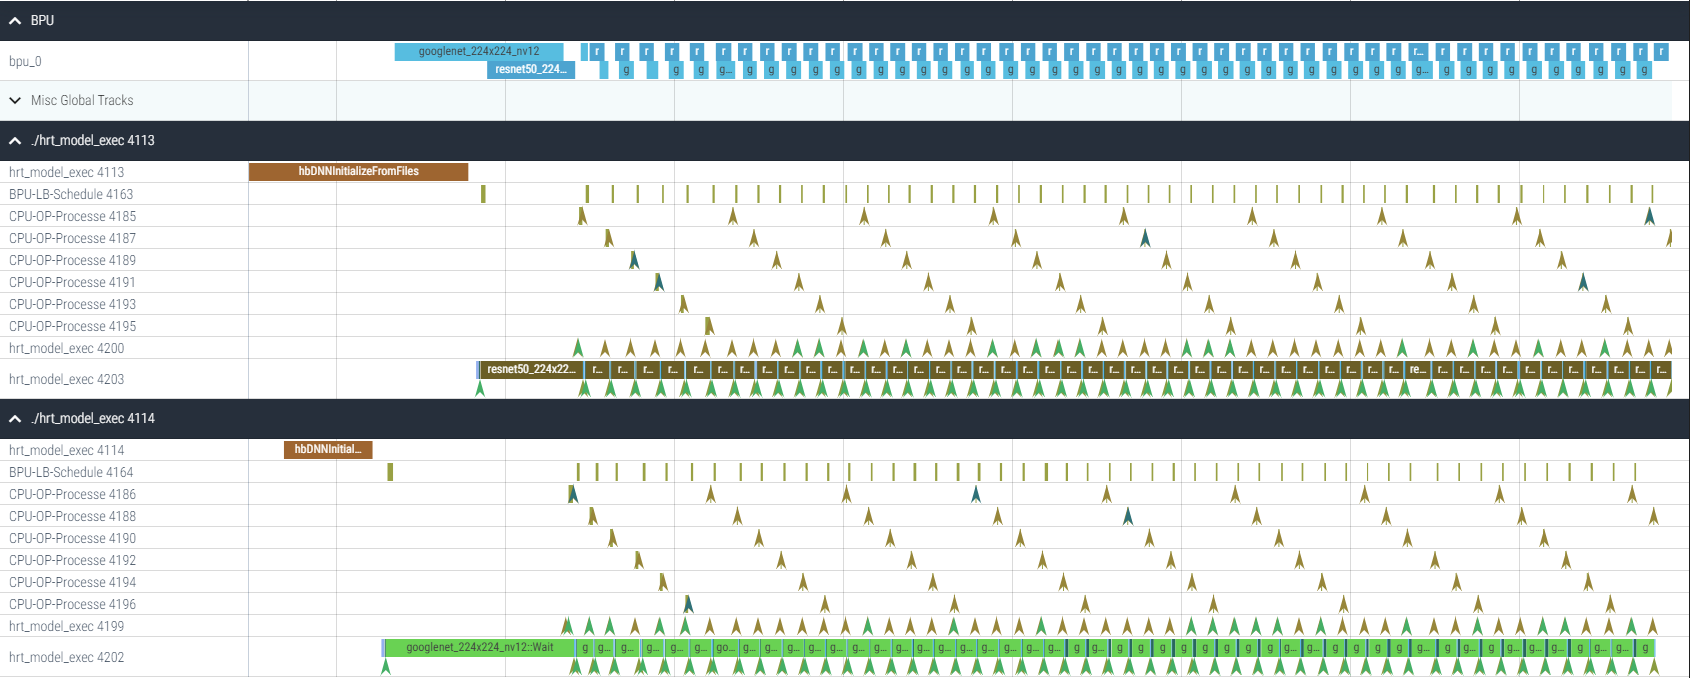
The following figure shows the scheduling status of different model inference tasks presented in BPU Trace:

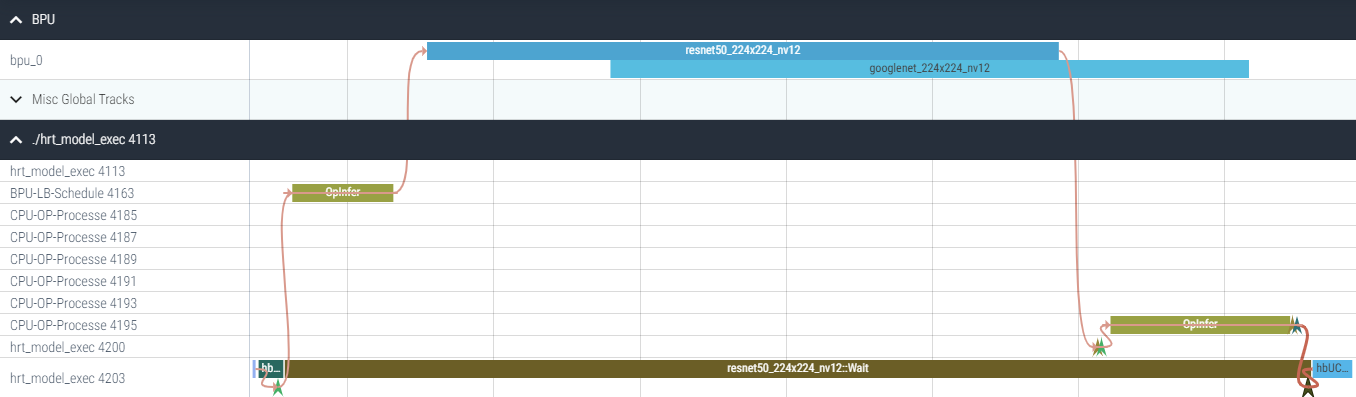
hbperfetto supports correlation between UCP Trace and BPU Trace. The following figure shows the complete flow from creation, submission, and scheduled execution of a UCP model inference task to task completion and final release.
In addition, you can query the raw BPU trace data through SQL.
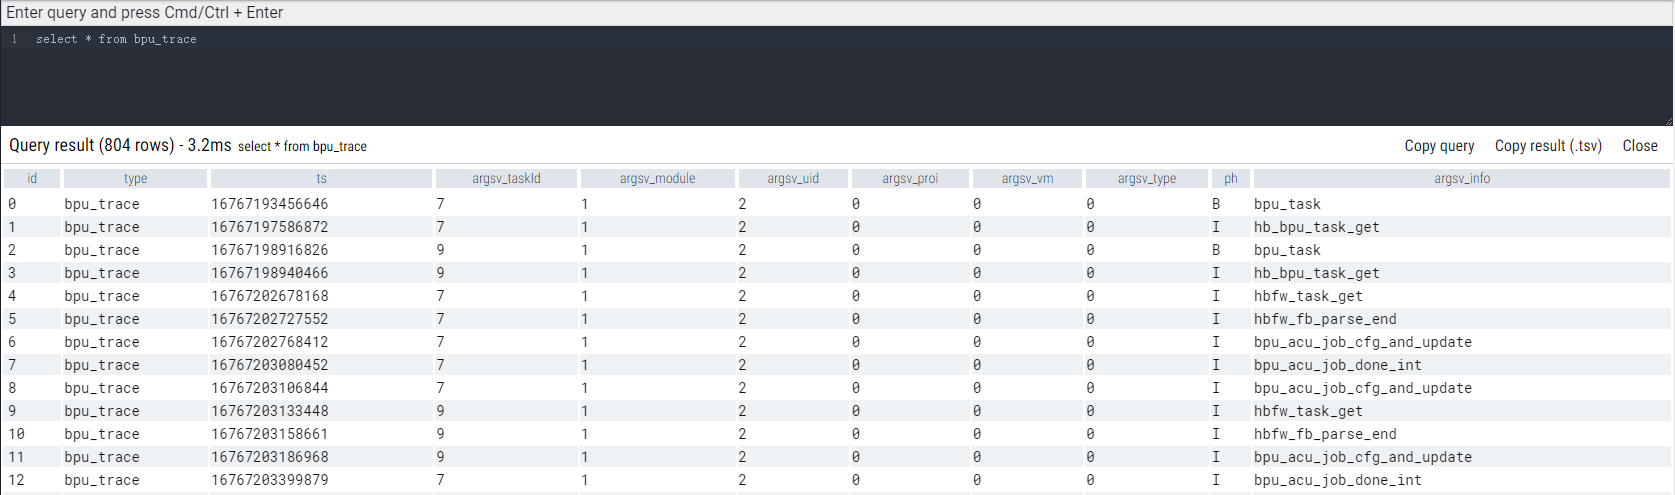
Chrome Trace
Chrome Trace supports capturing only UCP Trace and does not support multi-source capture. If you need to capture multiple data sources, use Perfetto Trace. Chrome Trace is simple and easy to use. It records traces in text logs and does not rely on additional third-party libraries or tools. If you only care about UCP scheduling logic, you can use Chrome Trace for capture.
Usage Example
-
Configure environment variables.
Before starting a new capture, it is recommended to delete the old log file first to avoid interference from old data.
-
Run the UCP application.
hrt_model_execis used here as an example. -
Run the trace capture script.
After trace log capture is complete, run
catch_trace.shprovided in the UCP release package to convert the raw trace log into a JSON-format trace file. -
Open
ucp_trace_task.jsonanducp_trace_thread.jsonwith Perfetto UI.Perfetto UI opening
ucp_trace_thread.json: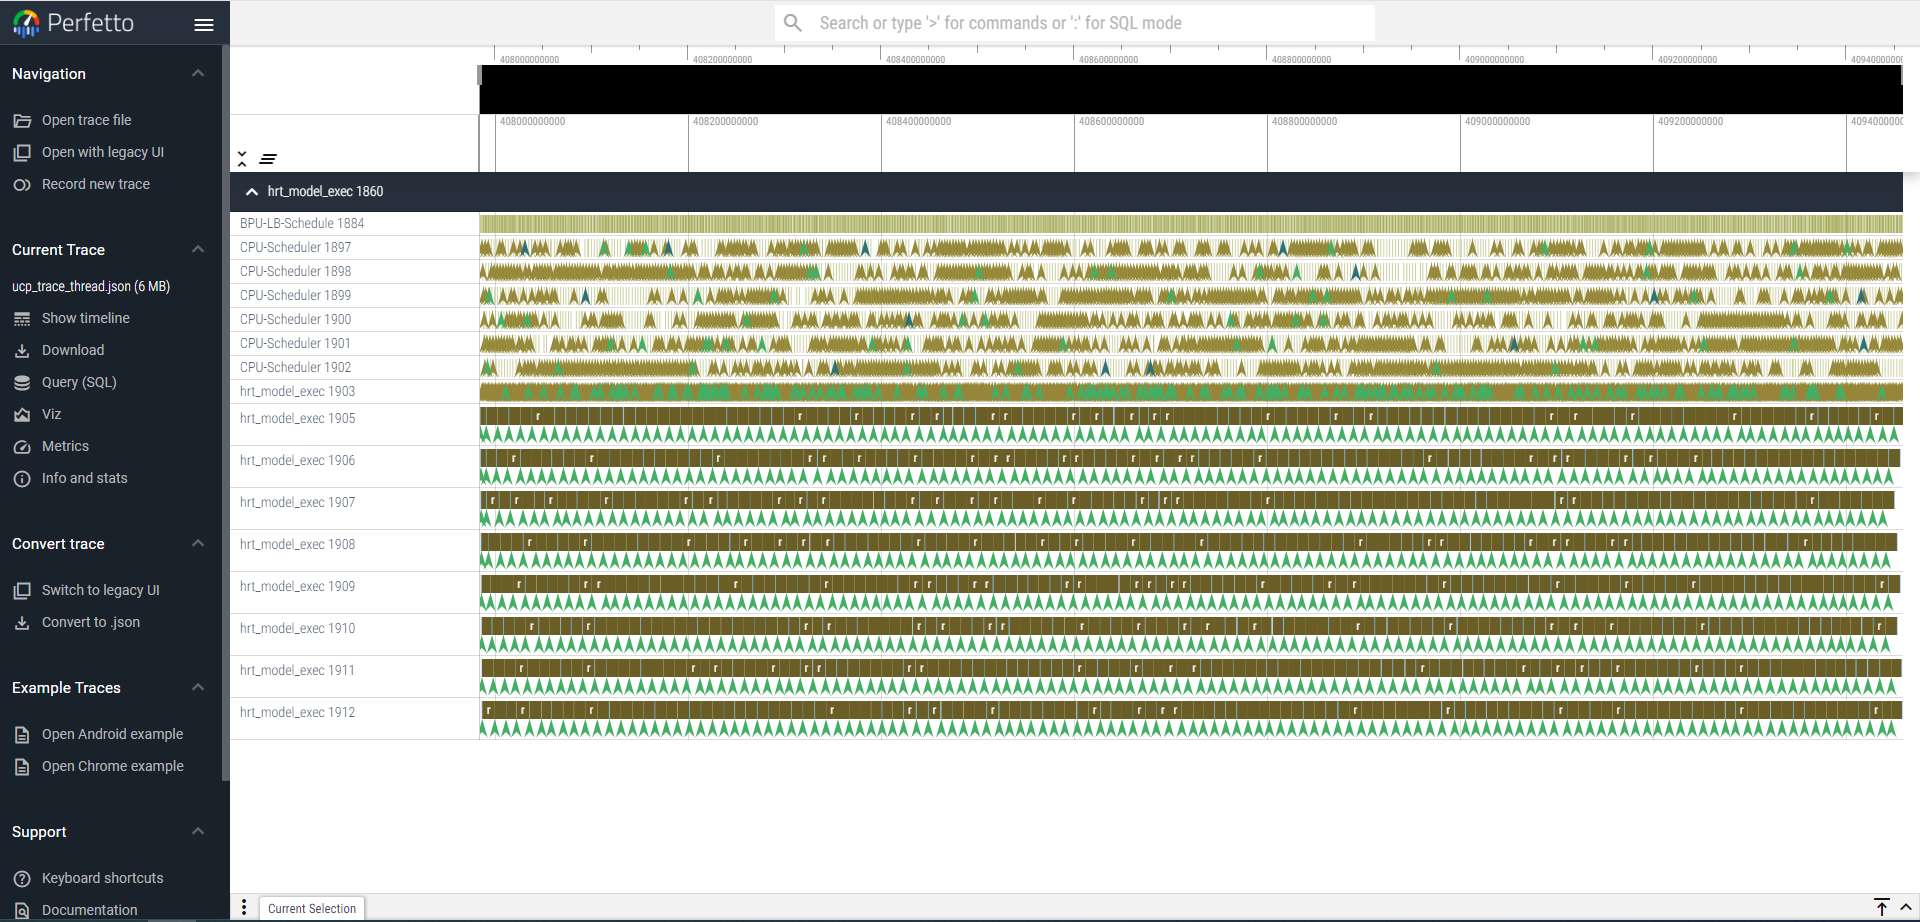
Configuration and Tooling
Tool and Configuration File Locations
UCP Trace tools and configuration files are located in samples/ucp_tutorial/tools. The directory structure is as follows:
Environment Variables
Perfetto Trace has higher priority. If export HB_UCP_ENABLE_PERFETTO=true and export HB_UCP_TRACE_LOG_LEVEL=0 are both set, only Perfetto Trace is started and the UCP Trace log level is ignored.
Configuration File Parameters
UCP Trace Configuration File Parameters
| Parameter | Data Type | Description | Related Parameter |
backend | string | Function:
| None. |
trace_config | string | Function: This parameter is a configuration file in protobuf text format. | This parameter takes effect only when backend is set to "in_process". |
The UCP Trace configuration file is optional. If your application has already initialized Perfetto, you only need to set export HB_UCP_ENABLE_PERFETTO=true to enable Perfetto.
Long Trace Configuration File Parameters
By default, Perfetto stores trace data in an in-memory buffer and dumps the buffered data to a file only when the trace session ends. If the volume of trace data exceeds the buffer capacity, data integrity cannot be guaranteed.
Perfetto supports periodically writing buffered data to a file. You only need to add the following fields to the trace configuration file.
Configuration File Templates
UCP Trace Configuration File Template
Used to configure how UCP uses Perfetto. You can specify it through the environment variable HB_UCP_PERFETTO_CONFIG_PATH.
in_process Mode
System Mode
When backend is set to system, there is no need to specify trace_config for UCP separately.
Perfetto Configuration File Template
For details about Perfetto configuration files, refer to the Perfetto TraceConfig Reference.
UCP provides reference configuration files ucp_in_process.cfg and ucp_system.cfg, which you can modify according to your application scenario.
BPU Trace Configuration File Template
In system mode, BPU trace capture is supported. You only need to add the BPU trace data source to the Perfetto configuration file. The ucp_bpu_trace.cfg file already includes the BPU trace data source by default, and the relevant configuration is shown below:
The bputrace_period_ms is used to set the interval for reading BPU Trace. You can adjust this parameter according to the actual usage scenario. When the BPU load is high, you can appropriately shorten the interval to avoid trace data being overwritten due to mismatched read and write speeds.
Currently, BPU Trace does not support dynamic enabling at runtime. If you need to capture BPU Trace data in real time while the application is running, you must enable this feature manually before the application starts. The command is: echo 1 > /sys/devices/system/bpu/bpu0/trace. Before executing this command, make sure the value of /sys/devices/system/bpu/bpu0/power_enable is 0. If it is not 0, run echo 0 > /sys/devices/system/bpu/bpu0/power_enable first.
DSP Trace Configuration File Template
In system mode, DSP trace capture is supported. You only need to add the DSP trace data source to the Perfetto configuration file. The ucp_dsp_trace.cfg file already includes the DSP trace data source by default, and the valid configuration is shown below:
dsptrace_period_ms is used to set the interval for reading DSP Trace. You can adjust this parameter according to the actual usage scenario. When the DSP load is high, you can appropriately shorten the interval to avoid trace data being overwritten due to mismatched read and write speeds.
Currently, DSP Trace does not support dynamic enabling at runtime. If you need to capture DSP Trace data in real time while the application is running, you must enable this feature manually before the application starts. The reference commands are as follows:
UCP Trace Record Points
UCP embeds trace records in application APIs and internal key scheduling paths, including task trace records and operator trace records.