
Performance Analysis Tool
The hb_analyzer tool is a performance analysis tool provided by Horizon Robotics for analyzing models or perf files. It supports generating performance analysis reports in HTML format at both the model and operator levels, and also enables visual inspection of the structure of *.onnx, *.bc, and *.hbm models.
Support Range
Supports original floating-point ONNX models, ptq.onnx models, various stages of HBIR models, and HBM models.
Usage
Parameters Introduction
The hb_analyzer tool requires specifying a scenario as needed. Currently, two scenarios are supported: analyze (model or file analysis) and visualize (model visualization).
Please specify the scenario according to actual usage and configure the corresponding parameters.
| --march | Required for non-fixed-point models | Specify the computing platform |
| --ip | Optional | Specify the board IP
1. IP not specified: Obtain estimated performance via hbm_perf
2. IP specified: Obtain measured performance via hbm_perf |
Usage Example
Taking model.onnx as an example, command-line example for ONNX model analysis:
Taking model.bc as an example, command-line example for BC model analysis:
Taking model.hbm as an example, command-line example for HBM model with on-board measurement analysis:
Taking perf.json as an example, command-line example for JSON analysis:
Command-line example for visualization:
The output includes two parts: log file output and HTML report output. The log file contains formatted performance analysis report information, while the HTML is another form with improved readability through charts, tables, etc., with no difference in information scope.
HTML Report Description
This report systematically displays the computational characteristics, quantization configuration, and runtime performance of the model in a visual page format, helping you analyze model performance step by step from the overall to the detail level, and providing data support for subsequent optimization.
Overview Page
The Overview page is used for a quick analysis of the model from an overall perspective, serving as the core entry point for "global perception" in the report. This page focuses on displaying the overall characteristics of the model around dimensions such as model scale, quantization configuration, backend execution characteristics, and performance hotspots.
Through the Overview page, you can, without delving into operator details:
-
Quickly understand the computational complexity and resource consumption level of the model.
-
Judge the overall performance of the model in the current deployment scenario.
-
Initially identify potential performance bottleneck directions (such as compute-intensive or IO-intensive).
It is recommended to focus on this page in the following scenarios:
-
First-time model analysis or quick result checking.
-
Overall comparison between different models or different quantization schemes.
-
Making a macro judgment on model performance before entering detailed operator analysis.
The Overview page is used to quickly understand the overall situation of the model. At the top of the page, a set of key indicators is first displayed, including model computation, Latency, memory-related information, etc.
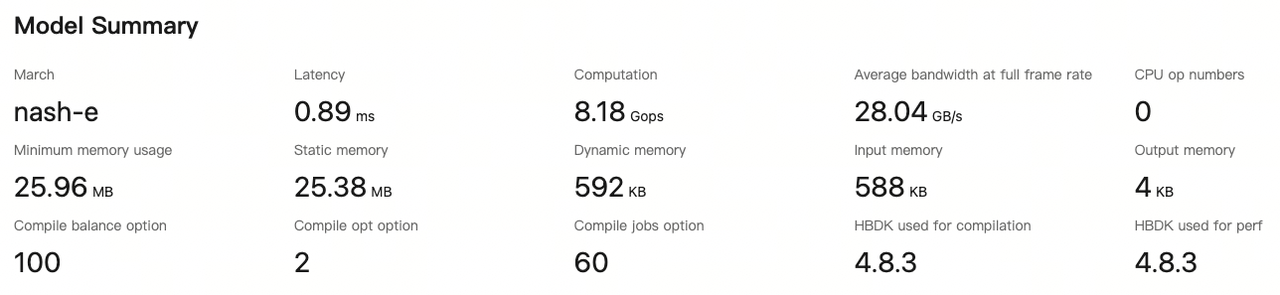
Through these indicators, you can quickly grasp the overall performance characteristics and resource consumption level of the model in the current scenario without expanding specific operator details.
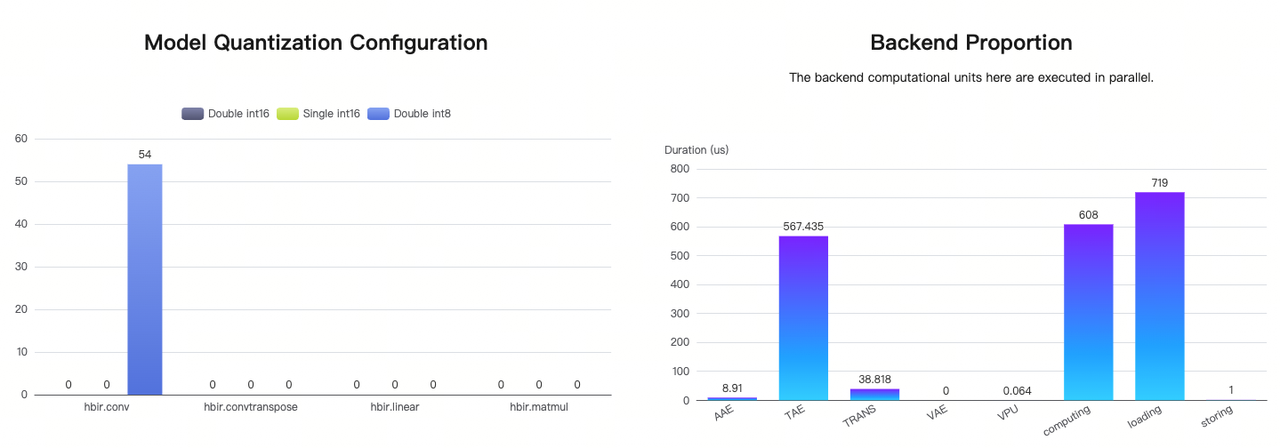
Two core charts are displayed in the middle of the page:
-
Model Quantization Configuration: Model Quantization Configuration Distribution
This chart statistically displays the quantity distribution of four typical operators (
Conv,ConvTranspose,Linear,MatMul) under different quantization configurations (dual int8, single int16, dual int16) by operator type.Through this chart, you can intuitively understand the composition of quantization strategies adopted by different operators in the model, providing a reference for analyzing the trade-off between performance and accuracy.
-
Backend Proportion: Backend Time Distribution
This chart visually displays the execution time of the model on different backend computing units by computing component. Note that the different computing components here usually execute in parallel, so this chart is mainly used to observe the relative time distribution of each computing unit, rather than simple serial time accumulation.
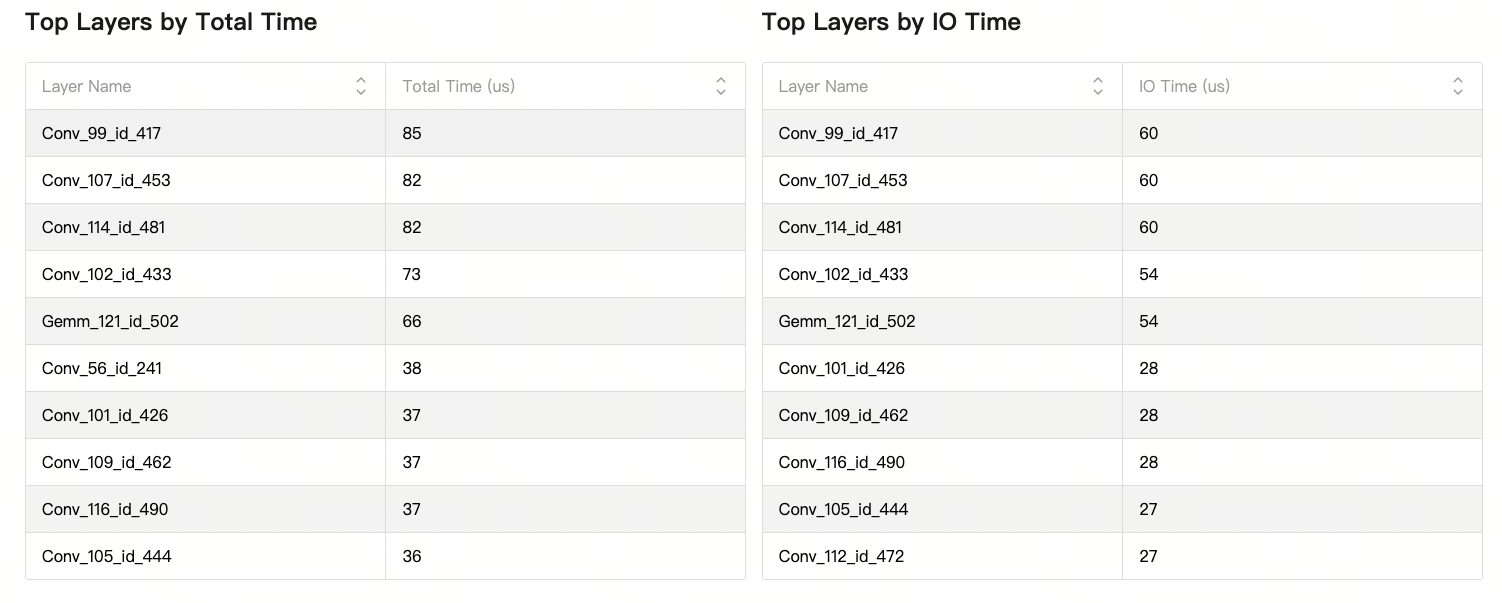
Below the charts, the page displays two Top lists:
-
Top Layers by Total Time
Statistics of the
Top 10operators with the highest total time consumption, used to quickly locate the operators with the largest overall time proportion. -
Top Layers by IO Time
Statistics of the
Top 10operators with the highest IO time consumption, helping to analyze potential memory access bottlenecks in the model.
These two tables can assist you in quickly identifying performance hotspot operators from different perspectives.
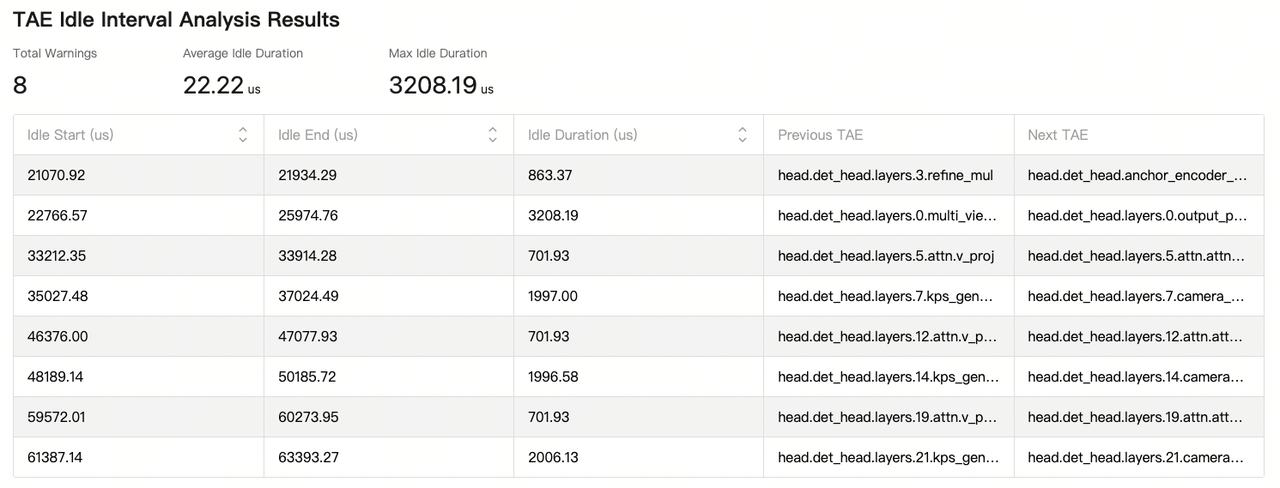
The tool also statistically analyzes the idle time of TAE, including idle quantity statistics, average idle time, and maximum idle time indicators, for your quick identification.
When an excessively long idle period (>500us) occurs, we will also provide a corresponding analysis table for your analysis and inspection.
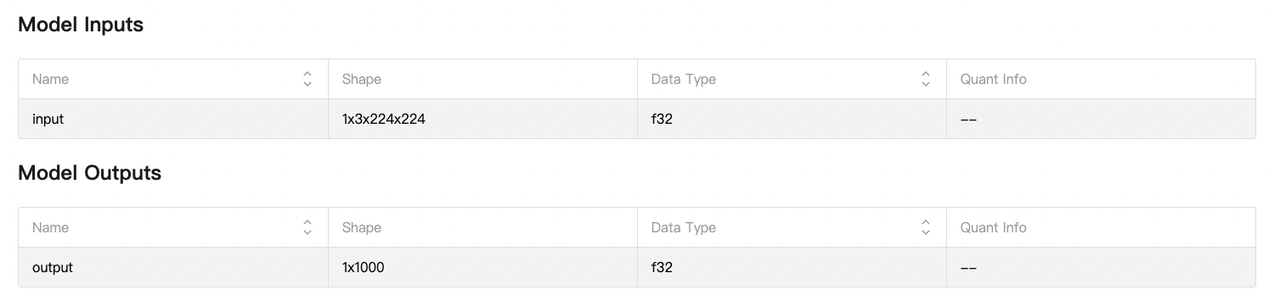
The last part of the Overview page displays the input and output information of the model, which statistically lists the Name, Shape, Data Type, and Quant Info of the model. Through this part of information, you can quickly check the structure and quantization information of the model input and output to confirm whether the model configuration meets expectations.
Operator Details Page
The Operator Details page is used to analyze the structure and computational characteristics of the model at the operator granularity, serving as an important link connecting overall analysis and in-depth tuning. This page takes operators as the basic analysis unit, displays the type, input and output characteristics, and data type of each operator in the model in detail, and supports comparative viewing of floating-point models and fixed-point models.
Through this page, you can:
-
Clearly understand the operator composition and execution order of the model.
-
Compare changes in operator structure and data type before and after quantization.
-
Assist in locating the position and role of specific operators in the model.
This page is usually focused on in the following scenarios:
-
Analyzing the impact of quantization on model structure and operator distribution.
-
Locating specific information of a certain type of operator or a specific operator.
-
Providing basic reference for subsequent operator performance analysis and tuning.
The page first displays the computation statistics of the floating-point model stage and the fixed-point model stage, used to compare the overall computational scale changes of the model before and after quantization.

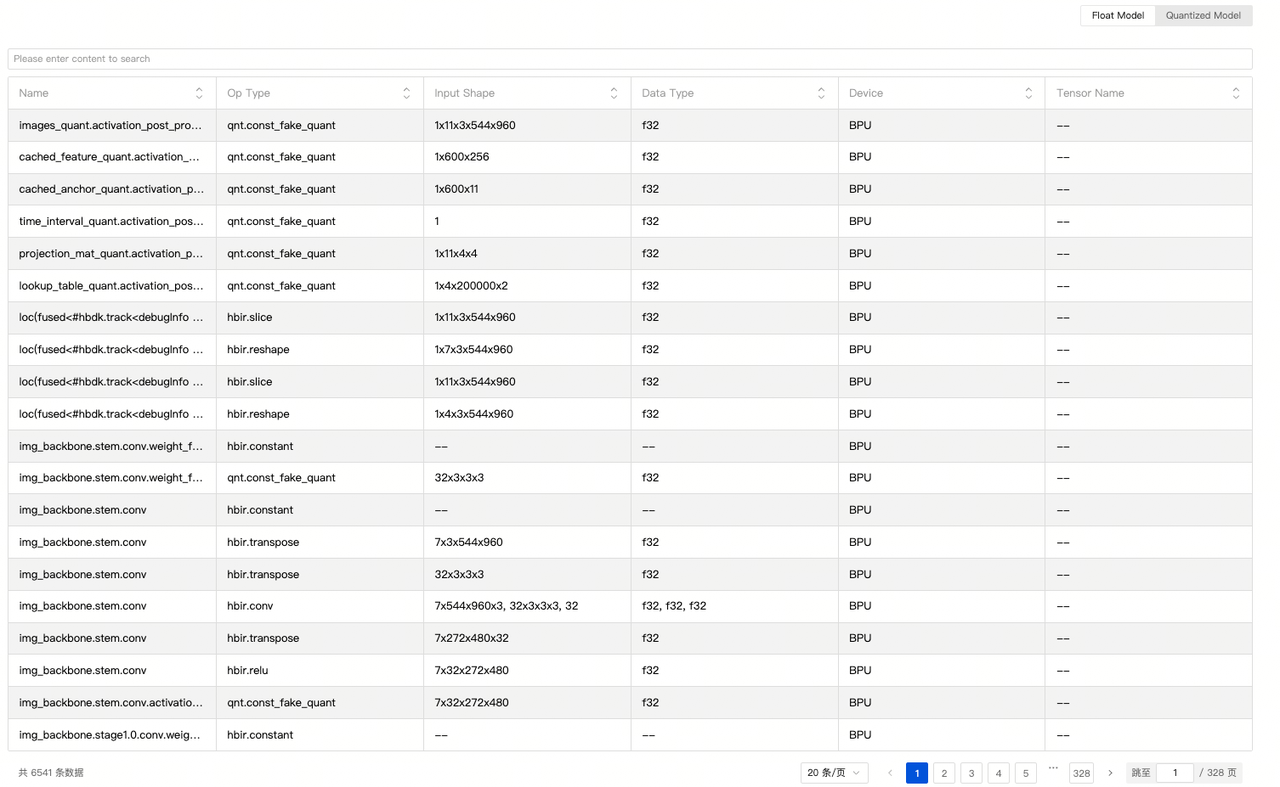
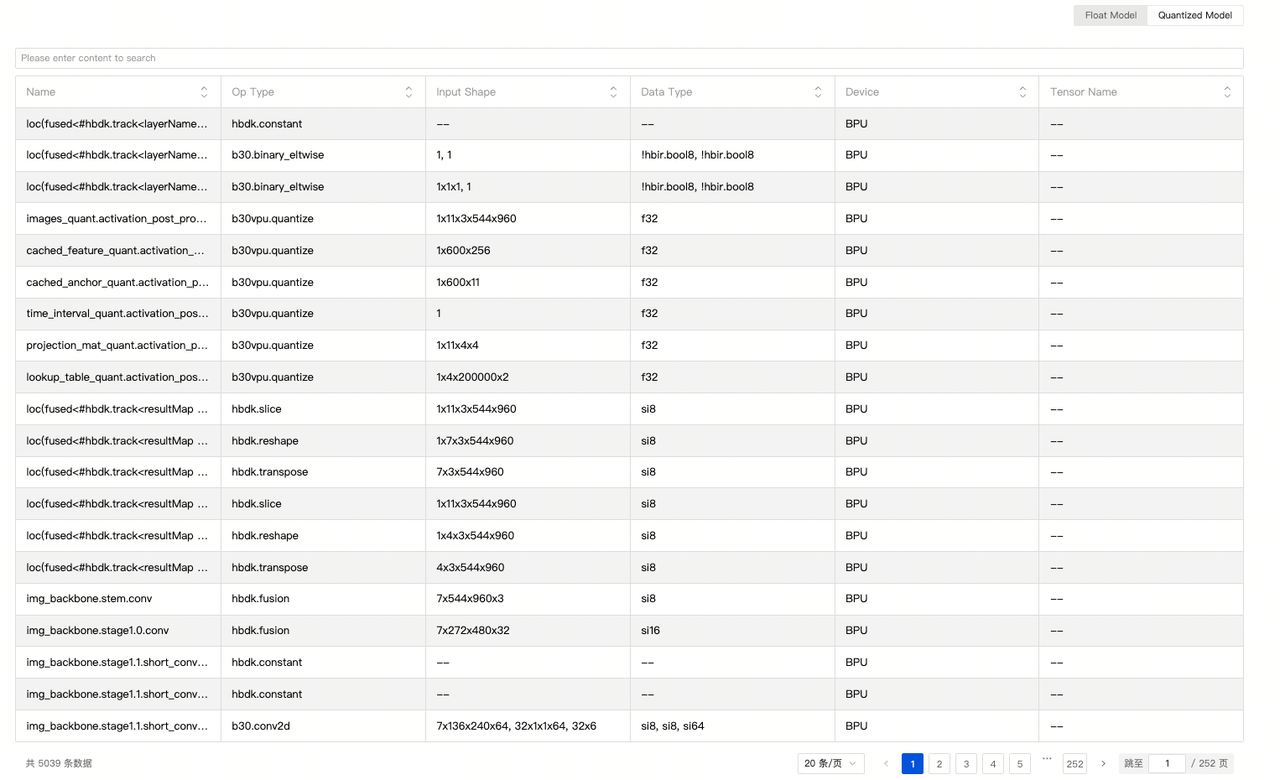
Below the statistics, we provide the operator information display of the floating-point model and the fixed-point model in a table format, supporting you to switch between the two models for viewing.
The table contains key information such as operator Name, Op Type, input Shape, Data Type, and output Tensor Name. Through this table, you can have a clear and complete understanding of the operator structure of the model.
The floating-point model display information is as follows:
The fixed-point model display information is as follows:
Operator Analysis Page
The Operator Analysis page is oriented to performance analysis and tuning scenarios, used for in-depth analysis of the model execution process from dimensions such as time and bandwidth. This page focuses on operator execution time, breakdown of computation and memory access overhead, and custom aggregation analysis capabilities, helping you understand the source of model performance bottlenecks from multiple angles.
Through this page, you can:
-
Evaluate the model's demand for system bandwidth resources under a given Designed FPS.
-
Analyze the overall time consumption distribution from operator type and custom classification dimensions.
-
Perform aggregated performance analysis on the operator set of interest through custom classification.
This page is mainly applicable to the following scenarios:
-
Performance bottleneck location and optimization analysis.
-
Performance evaluation before model deployment.
-
Targeted tuning for specific businesses or operator patterns.
In the operator analysis page, you can set the Designed FPS value, and the page will automatically calculate the corresponding average bandwidth demand based on the DDR data volume of the current model.

This function can be used to evaluate the model's demand for bandwidth resources at the target frame rate during the performance tuning phase.
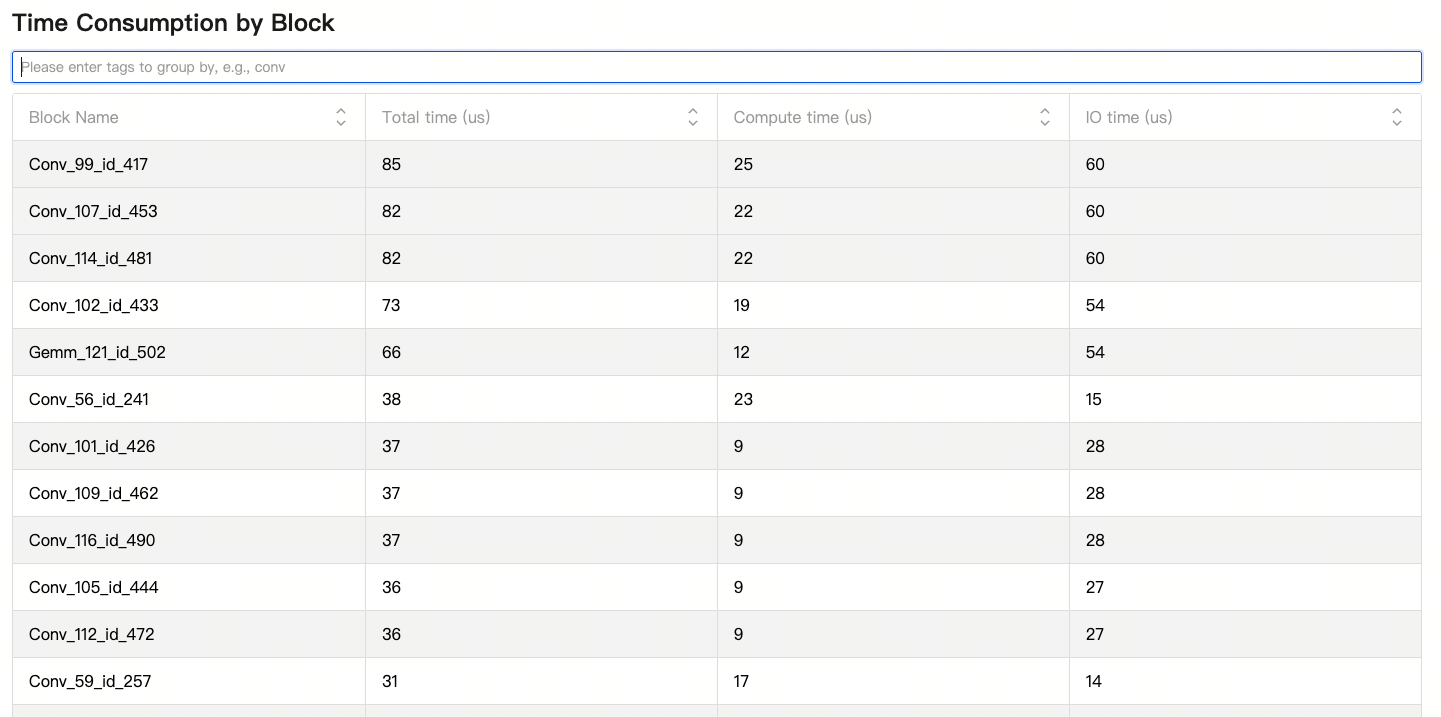
Below, we provide an operator analysis table. In this page, the execution time of the model is statistically analyzed by operator type, displaying the total time, computation time, and Load/Store time of each operator type in the model, helping to analyze the impact of different operator types on overall performance from a macro perspective.

In addition, we also support custom operator classification analysis on this page. You can customize the grouping of operators or Blocks by entering keywords. The system will classify the eligible operators into corresponding categories according to the name matching rules and automatically count the time consumption information of each category.
Through this method, you can flexibly perform aggregated analysis on operators in the model from a business or structural perspective, and locate performance bottlenecks more efficiently.